Lecture 01a – Welcome to ENVX1002

ENVX1002 Statistics in Life and Environmental Sciences

Liana Pozza

The University of Sydney

Mar 2026

Welcome

About us…

Liana Pozza - Unit Coordinator

  • Room 303, Level 3, Biomedical Building C81, 1 Central Ave, Eveleigh
  • Ph: 02 8627 1012
  • Email: liana.pozza@sydney.edu.au

Your Lecturers

Januar Harianto
Weeks 1 – 4

Floris van Ogtrop
Weeks 5 – 8

Liana Pozza
Weeks 9 – 12

About ENVX1002

Learning outcomes

  • LO1. Implement basic reproducible research practices – including consistent data organisation, documented code, and version-controlled workflows so that statistical analyses and results can be readily replicated and validated by others.
  • LO2. Demonstrate proficiency in utilising R and Excel to effectively explore and describe life science datasets.
  • LO3. Apply parametric and non-parametric statistical inference methods to experimental and observational data using RStudio and effectively interpret and communicate the results in the context of the data.
  • LO4. Be able to put into practice both linear and non-linear models to describe relationships between variables using RStudio and Excel, demonstrating creativity in developing models that effectively represent complex data patterns.
  • LO5. Be able to articulate statistical and modelling results clearly and convincingly in both written reports and oral presentations, working effectively as an individual and collaboratively in a team, showcasing the ability to convey complex information to varied audiences.

Delivery format

All lectures are held in ABS Lecture Theatre 1130.

Lab sessions are held in the Biomedical Building C81, 1 Central Avenue, Eveleigh.

  • Lectures (hybrid): deliver content, provide context, and introduce new concepts, applying concepts
  • Labs: hands-on practice with R and data analysis, with demonstrators to help you

The following are optional (but highly recommended):

  • Drop-in sessions: additional help and support, mostly on Zoom
  • Ed discussion: online forum for questions and discussions

Timetable

Lectures (hybrid)

  • Monday 12pm–1pm, ABS Lecture Theatre 1130
  • Tuesday 9am–11am, ABS Lecture Theatre 1130

Computer Labs

  • 2-hour in-person lab session with tutors and demonstrators
  • Biomedical Building C81, 1 Central Ave, Eveleigh
  • See timetable for your allocated time

Schedule at a glance…

Code
sequenceDiagram
  participant M as Mon
  participant T as Tue
  participant W as Wed
  participant Th as Thu
  participant F as Fri
  participant S as Sat
  participant Su as Sun

  Note over M,T: Lectures (hybrid) - ABS LT 1130
  Note over T,Th: Lab Sessions - Biomedical Building
  Th->>+Su: Self-revision, pick ONE day (encouraged)

Resources

Where are the Labs?

  • Lab sessions include extra time (~30 minutes) for travel – already programmed in the timetable (so clashes are avoided)
  • We are working on securing a free shuttle service between campus and the labs - stay tuned!
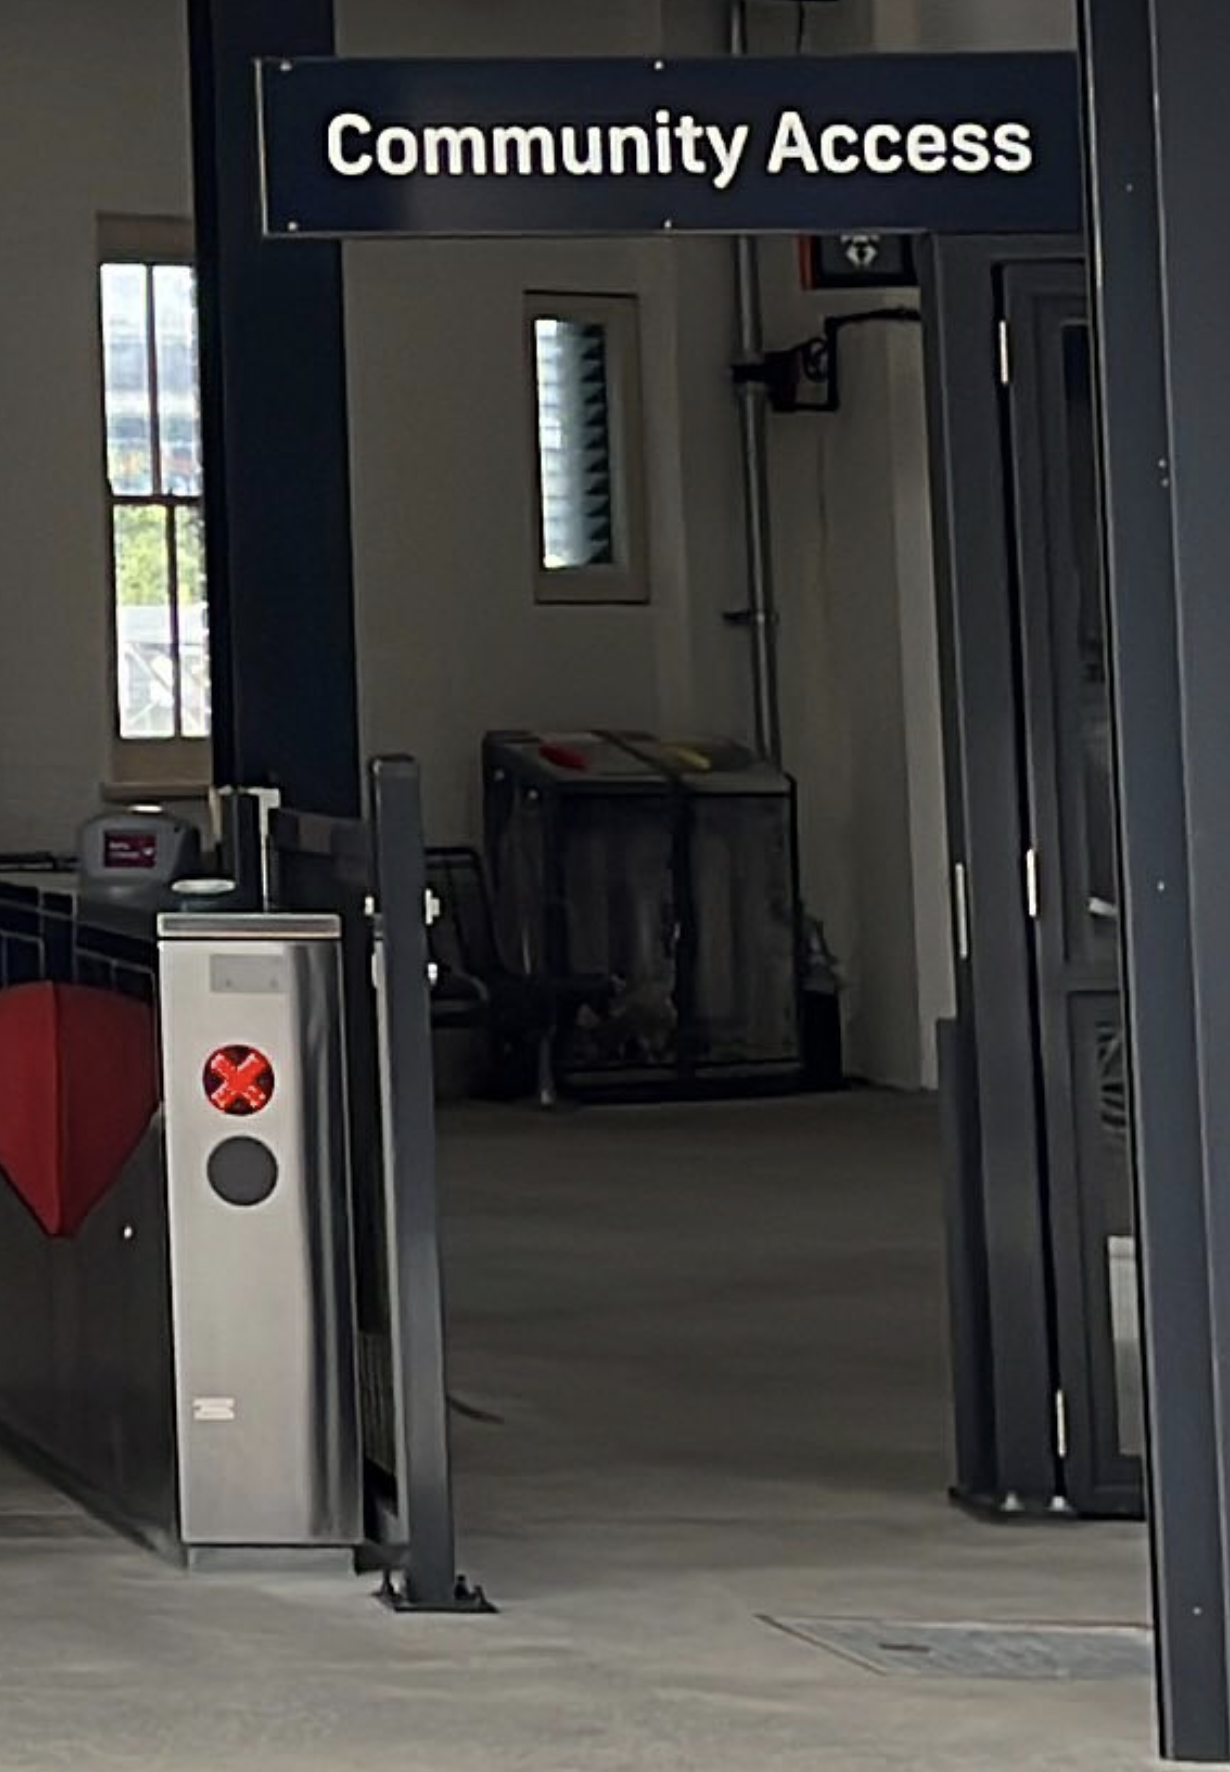
  • Take advantage of the new community access gates at Redfern Station: saves 5 minutes

Campus bus

There is currently a bus that goes to Redfern Station. You can find the timetable here: Campus Bus Timetables

We are looking to secure a bus service from main campus to C81, but need an idea of numbers first.

If you are interested in catching a shuttle bus to C81, please fill out this short survey:
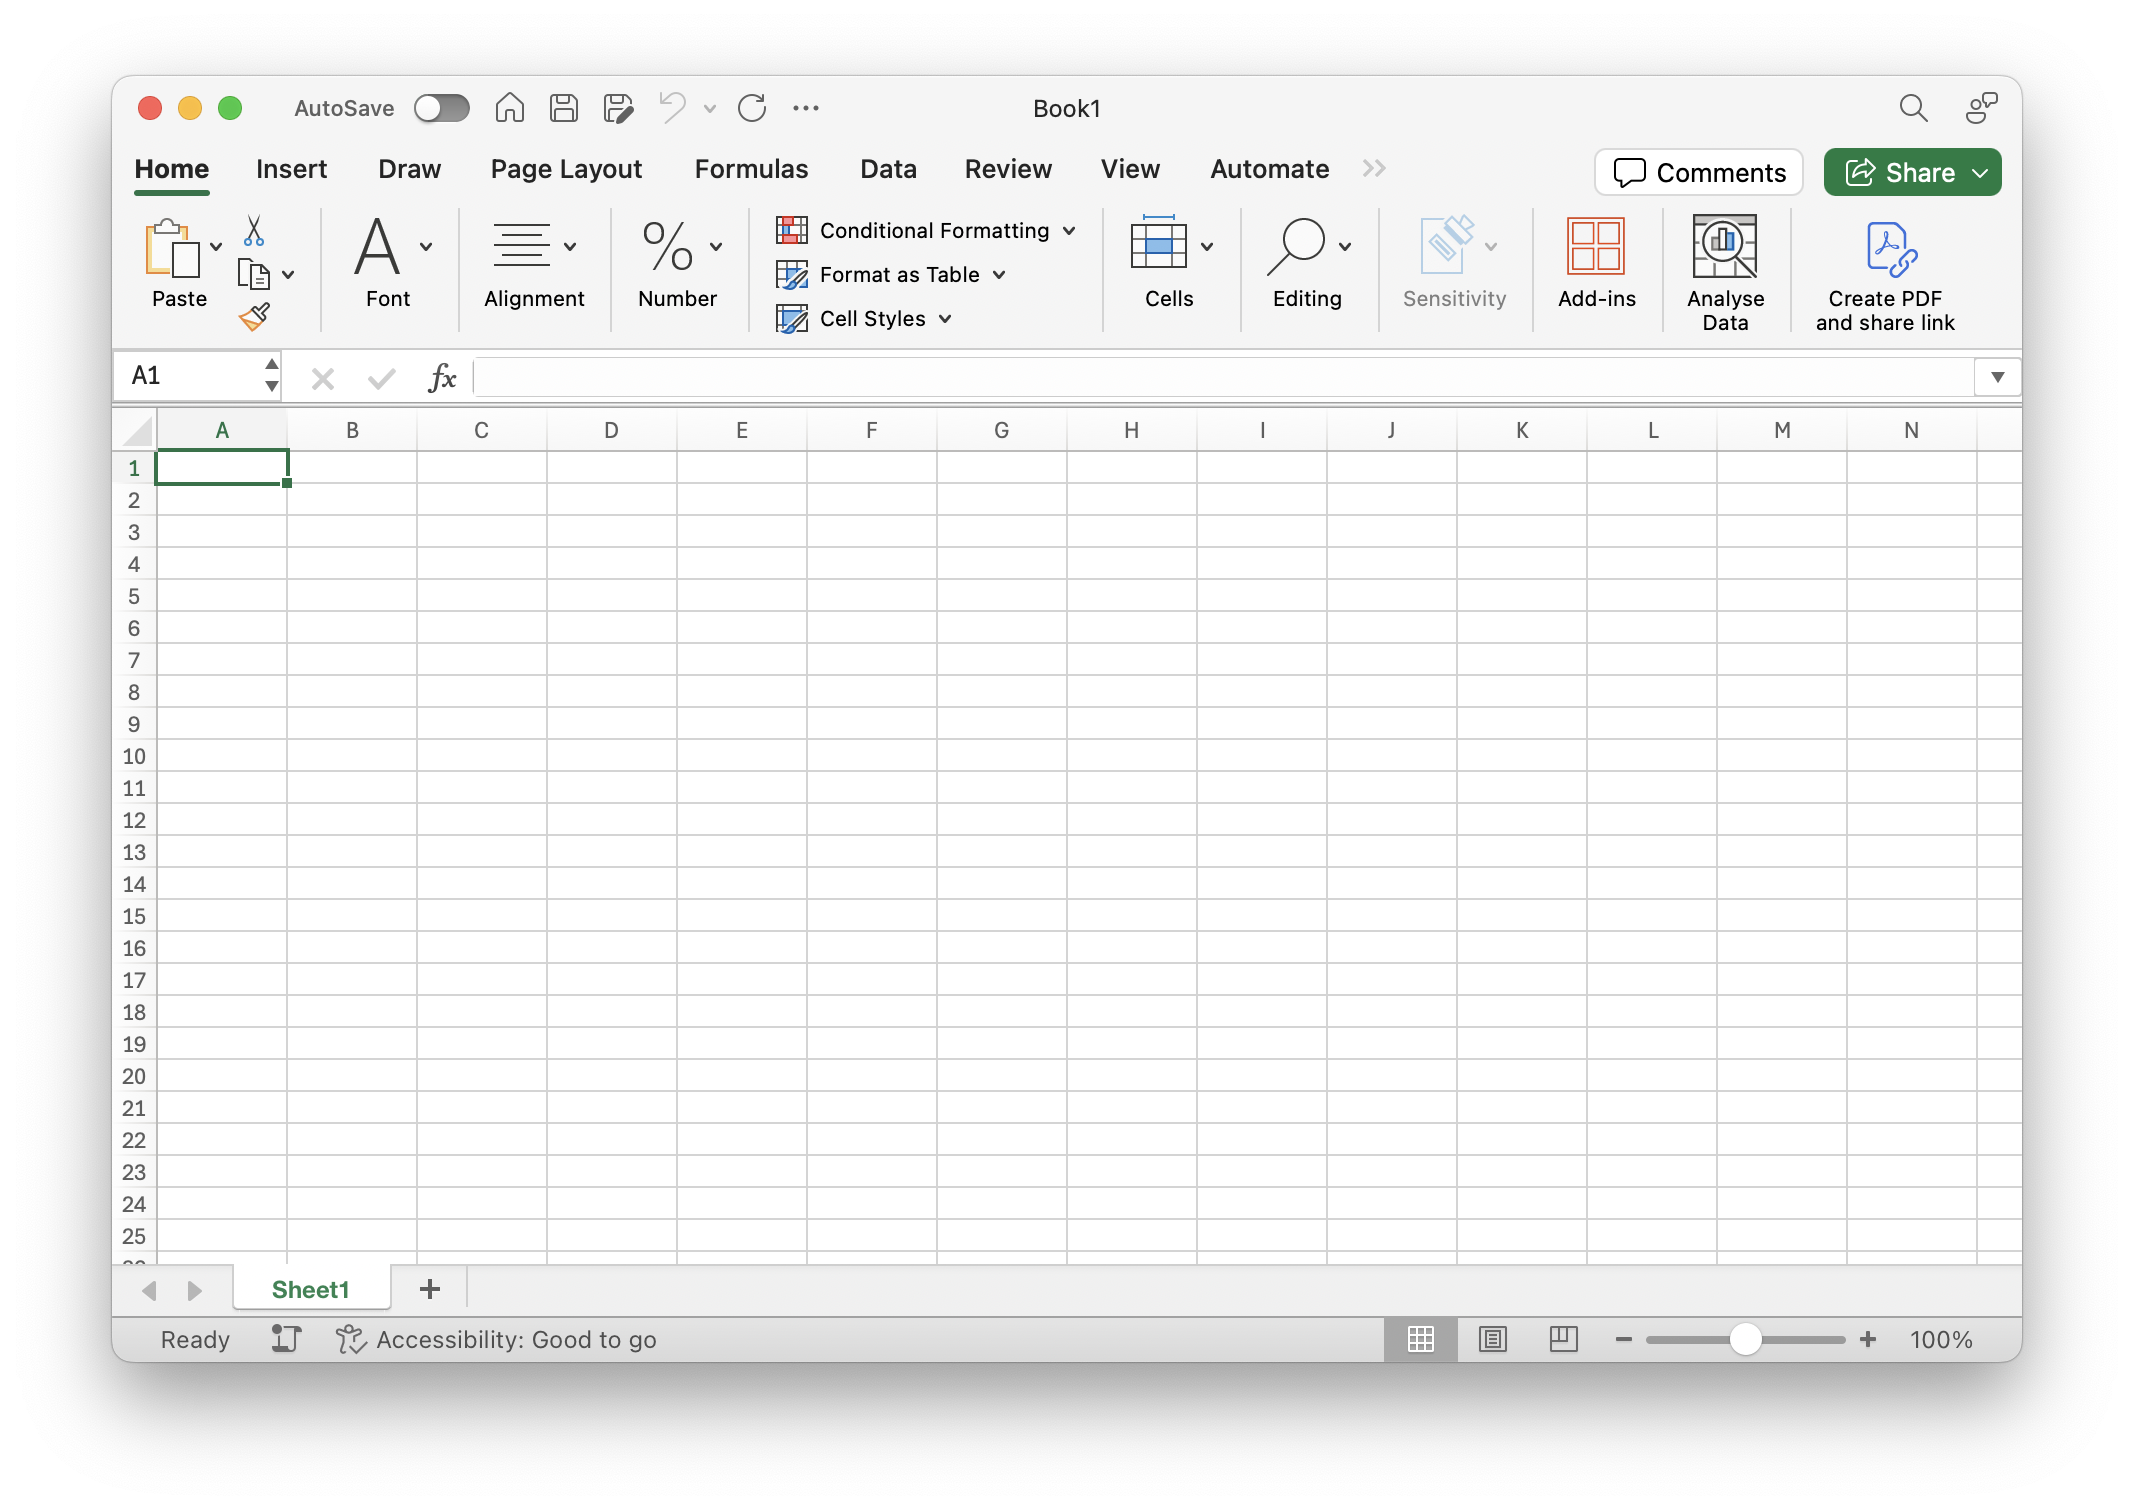
Content & assessments

Topic outline

  • Week 01 - Data: Reproducible Science
  • Week 02 - Data: Statistical Programming Basics
  • Week 03 - Data: Exploring and Visualising Data
  • Week 04 - Data: The Central Limit Theorem
  • Week 05 - Inference: Introduction to Inference
  • Week 06 - Inference: Comparing Two Samples
  • Week 07 - Inference: Non-parametric Methods
  • Week 08 - Inference: Building Statistical Confidence
  • Week 09 - Modelling: Describing Relationships
  • Week 10 - Modelling: Simple Linear Regression
  • Week 11 - Modelling: Multiple Linear Regression
  • Week 12 - Modelling: Non-linear Regression
  • Week 13 - Revision: Course revision and past exam questions

Assessments

Code
# calculate this year's year number
library(lubridate)
year <- year(Sys.Date())
address <- paste0(
    "https://www.sydney.edu.au/units/ENVX1002/",
    year,
    "-S1C-ND-CC"
)

The most up to date (and slightly more comprehensive) information for 2026 is here. In a nutshell:

Week Assessment Description
3 Early Feedback Task (individual 5%) In-person - 15 minutes
5 Describing Data Report (individual 15%) Written report, 500 words
8 Coding and data skills evaluation (individual 15%) In-person - 50 minutes
13 Group presentation: Modelling relationships in data (10% + Peer assessment 5%) Group presentation - 15 minutes
Exam Final exam (individual 50%) MCQ + SAQ Questions - 2 hours
  • Week 3: The early feedback task is a chance for us to gauge your understanding and provide feedback
  • Week 8: Coding and data skills evaluation covers R data manipulation and analysis
  • Final exam will NOT require you to write or interpret code – focus on understanding concepts and interpreting results

Final exam hurdle

The final exam is a hurdle assessment for this unit. This means:

  • You must attempt the exam and achieve a minimum score of 40% to pass the unit.

  • Students who do not meet this requirement will not be able to pass the unit, regardless of their overall mark.

This hurdle can be quite daunting, but we will are here to work with you and help you succeed.

We will provide the learning materials, guidance, and any support you need, and it is your responsibility to keep up with the content each week and ask us questions if there is something that isn’t quite making sense yet.

Software, tools and resources

The combination of some data and an aching desire for an answer does not ensure that a reasonable answer can be extracted from a given body of data.

John Tukey (1915 – 2000)

Baby steps…

  • This unit is designed for beginners - no prior statistics or programming required
  • We start with basics – pace increases after week 4
  • Focus on understanding concepts first, then tools
  • We provide plenty of support – more on this later

Our tech stack

  1. MS Excel – for data entry and basic analysis
  2. R – a programming language for data analysis
  3. RStudio – an integrated development environment (IDE) for R
  4. Quarto (Markdown) – a key platform for reproducible reports and documents
  5. GitHub Copilot – AI-powered code completion tool. Optional, we will introduce you to this later in the semester

MS Excel

  • Widely used for data entry and basic analysis
  • A standard tool in many industries, including science, often to store data
  • Can be a useful complement to R for data cleaning and simple calculations
  • A stepping stone to more advanced tools?

R


  • A free, open-source programming language
  • Widely used for data analysis and statistics
  • Standard tool in scientific research
  • Extensive collection of packages for data science
  • Strong support for creating publication-quality graphics
  • Large, active community for help and resources
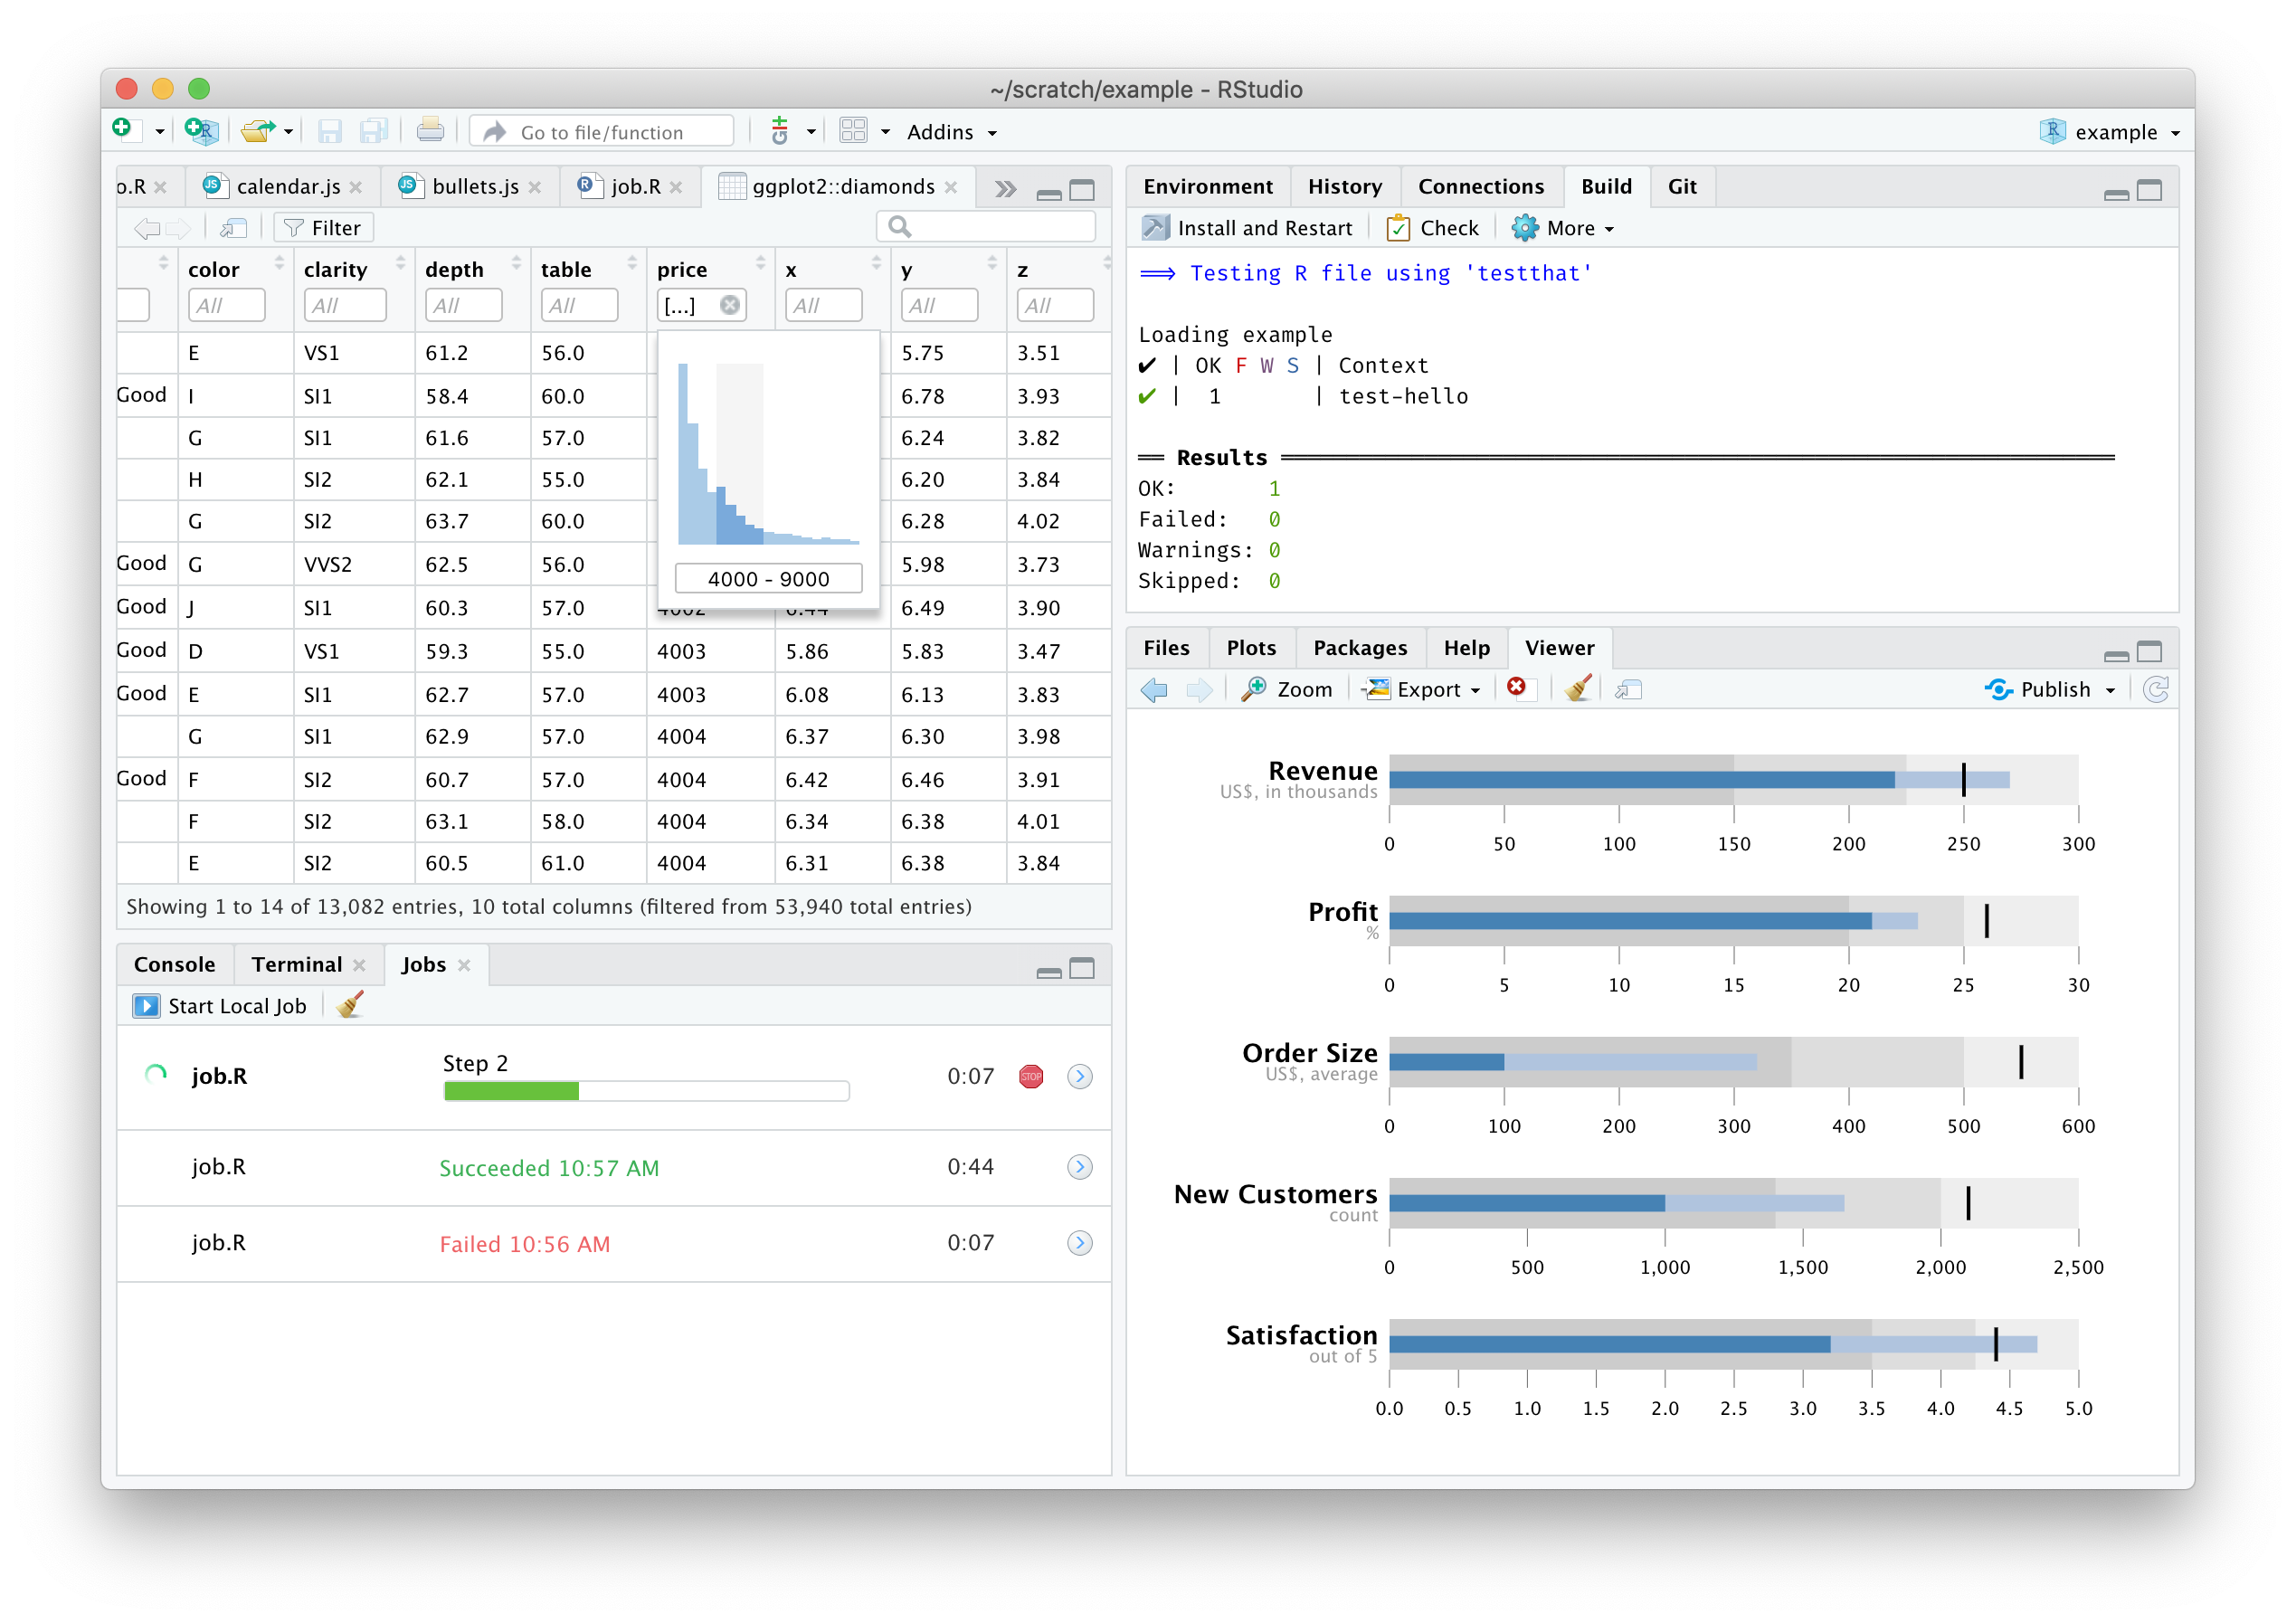
Why R?

  1. Built for beginners
  2. Makes your work reproducible
  3. Powerful yet accessible
  • Importantly – the skills you learn are highly transferable to other tools and languages.
  • Most easily integrated with generative AI tools – more on this soon
  • Well-documented and discussed online (so you can find help easily)

RStudio

  • NOT the same as R – it’s an integrated development environment (IDE)
  • Runs R (…and Python, and SQL, and more)
  • Makes it easier to write and run R code by providing a significantly more user-friendly interface

Starting with R

  • It’s normal to feel overwhelmed at first
  • We’ll learn step by step
  • Practice is key - a little bit each day helps
  • Don’t hesitate to ask questions!

Satisfying when it works

Click to see the code for this animation
# Load required packages
library(gapminder) # Dataset of country statistics over time
library(gganimate) # For creating animations in ggplot
library(tidyverse) # Collection of data science packages

# Create an animated plot showing how life expectancy relates to GDP
# across different continents over time
ggplot(
    gapminder,
    aes(gdpPercap, lifeExp, # GDP per capita vs life expectancy
        size = pop, # Point size represents population
        colour = country
    )
) + # Each country gets its own color
    geom_point(
        alpha = 0.7, # Semi-transparent points
        show.legend = FALSE
    ) + # Hide legend for cleaner look
    scale_colour_manual(values = country_colors) +
    scale_size(range = c(2, 12)) + # Set min/max point sizes
    scale_x_log10() + # Log scale for GDP (wide range)
    facet_wrap(~continent) + # Separate plot for each continent
    labs(
        title = "Year: {frame_time}",
        x = "GDP per capita",
        y = "Life expectancy"
    ) +
    transition_time(year) + # Animate through years
    ease_aes("linear") # Smooth transitions

Quarto

  • Marjority of our resources are built using Quarto – a markdown-based document format that you will learn to use in this unit
    • Lecture slides
    • Tutorials
    • Lab exercises
  • Quarto makes everything reproducible - what does it mean?
  • Free and open source, available on the ENVX resources GitHub repository – re-use and modify as you wish (but follow CC BY 4.0)
## Quarto

- Marjority of our resources are built using [**Quarto**](https://quarto.org/) -- a markdown-based document format that **you will learn to use** in this unit
  - Lecture slides
  - Lab exercises
- Quarto  makes everything **reproducible** - what does it mean?
- Free and open source, available on the [ENVX resources](https://github.com/ENVX-resources) GitHub repository -- re-use and modify as you wish (but follow [CC BY 4.0](https://creativecommons.org/licenses/by/4.0/))

R, RStudio, Quarto!?

  • Again, it’s normal to feel overwhelmed at first
  • These technologies are complementary – everything is implemented in RStudio
  • The lectures and practical classes will guide you through the process

Textbooks

This unit does not have a required textbook, but we do draw from a range of resources, including:

  • Quinn, G. P., & Keough, M. J. (2002). Experimental design and data analysis for biologists. Cambridge University Press.

There is an updated edition of this book, but we will mostly be drawing from the 2002 edition this year.

  • Mead, R. (2017). Statistical methods in agriculture and experimental biology (CRC Press., Ed.; Third edition.). CRC Press, an imprint of Chapman and Hall/CRC. https://doi.org/10.1201/9780203738559

These texts are available through the library, or in Canvas via the Reading List, which can be found on the left hand navigation bar in Canvas.

Statbot

Statbot is an AI-powered chatbot designed to assist you with any questions you may have about coding, statistical concepts, or even provide practice exam questions.

Access the bot here or in Canvas: Statbot

  • The bot is tailored to ENVX1002 and hosted on a secure server, ensuring your data and interactions are protected.
  • Statbot is available 24/7 to support your learning journey.
  • Input and conversations are de-identified, recorded, and monitored to ensure the bot is providing accurate and helpful responses, and to help us improve our teaching material week to week.

Thanks!

Tomorrow: Lecture (2h) – see you there!

This presentation is based on the SOLES Quarto reveal.js template and is licensed under a Creative Commons Attribution 4.0 International License.

References

  • Quinn & Keough (2002). Sections 1.1-1.2, pages 1-7.