Lecture 01b – Reproducible science
ENVX1002 Statistics in Life and Environmental Sciences
May 2026
About me
- Lecturer in Biostatistics/Data Science, also a research software engineer
- Marine ecophysiologist by training, studied echinoderms (sea stars, sea urchins, etc.) and coral reefs


The joy of stats
200 countries, 200 years, 4 minutes
In your own time: The best stats you’ve ever seen
Lionel Messi is impossible
It’s not possible to shoot more efficiently from outside the penalty area than many players shoot inside it. It’s not possible to lead the world in weak-kick goals and long-range goals. It’s not possible to score on unassisted plays as well as the best players in the world score on assisted ones. It’s not possible to lead the world’s forwards both in taking on defenders and in dishing the ball to others. And it’s certainly not possible to do most of these things by insanely wide margins.

Lionel Messi is impossible
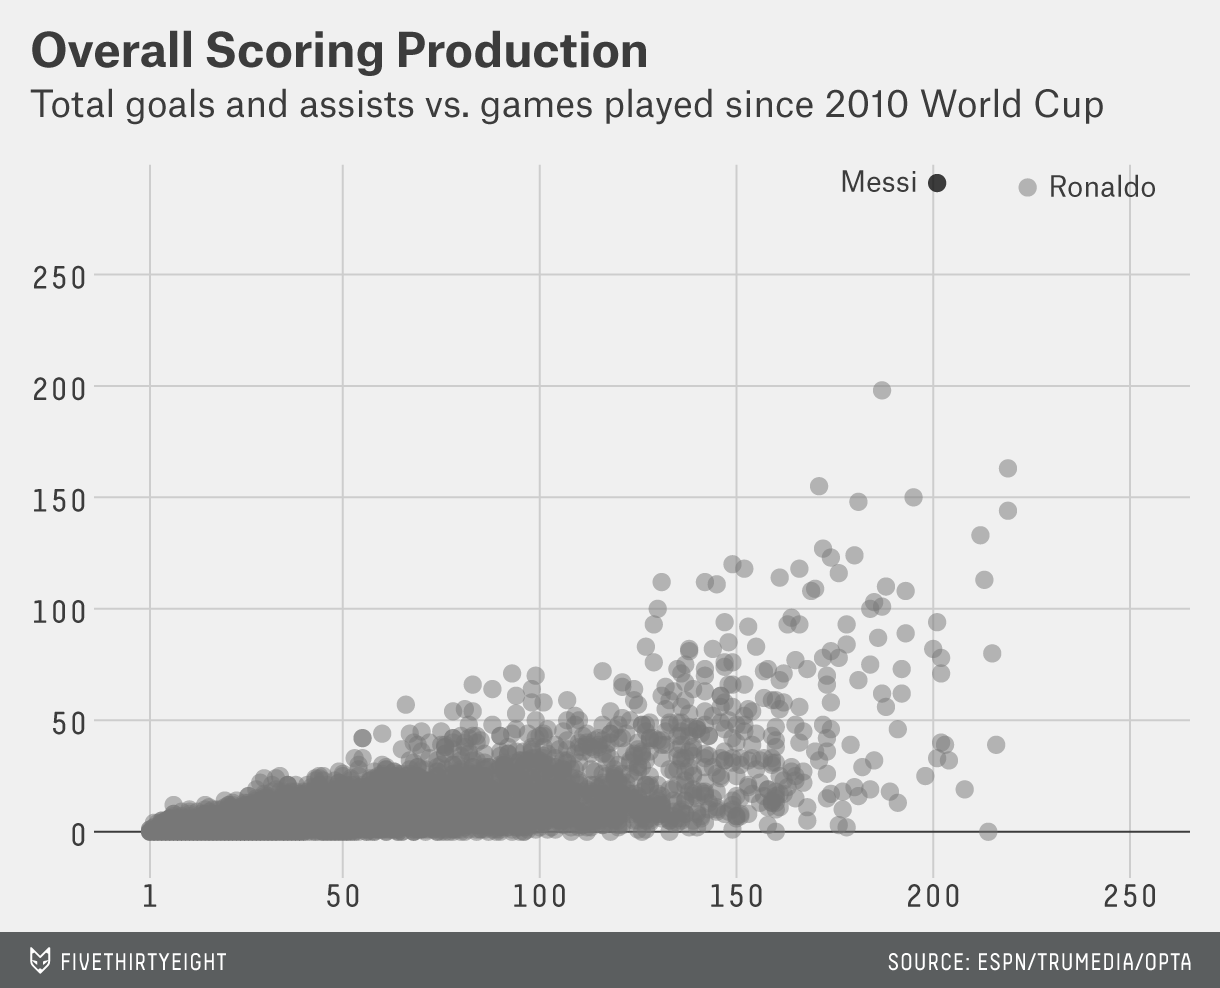
Source: fivethirtyeight
Lionel Messi is impossible
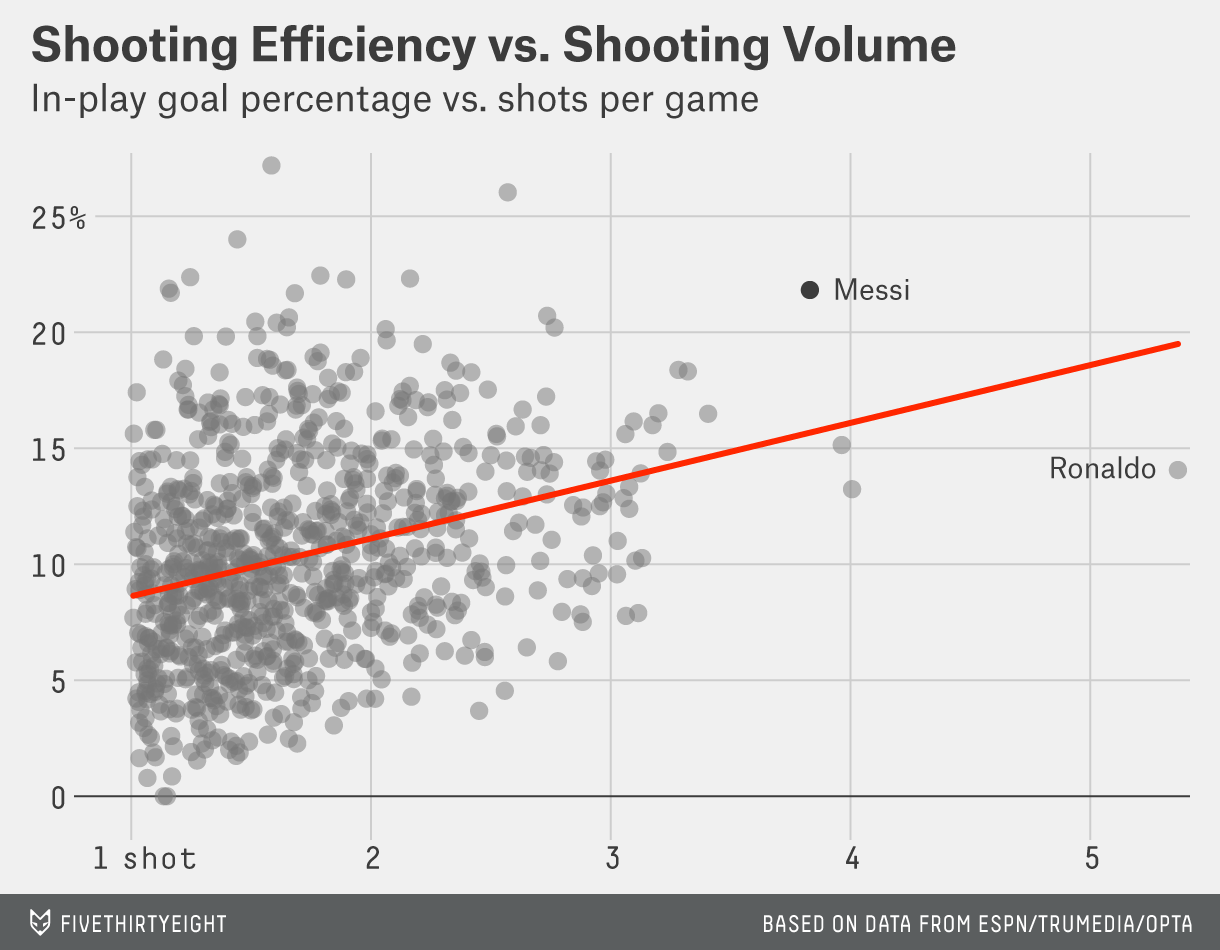
Source: fivethirtyeight
Serious stats
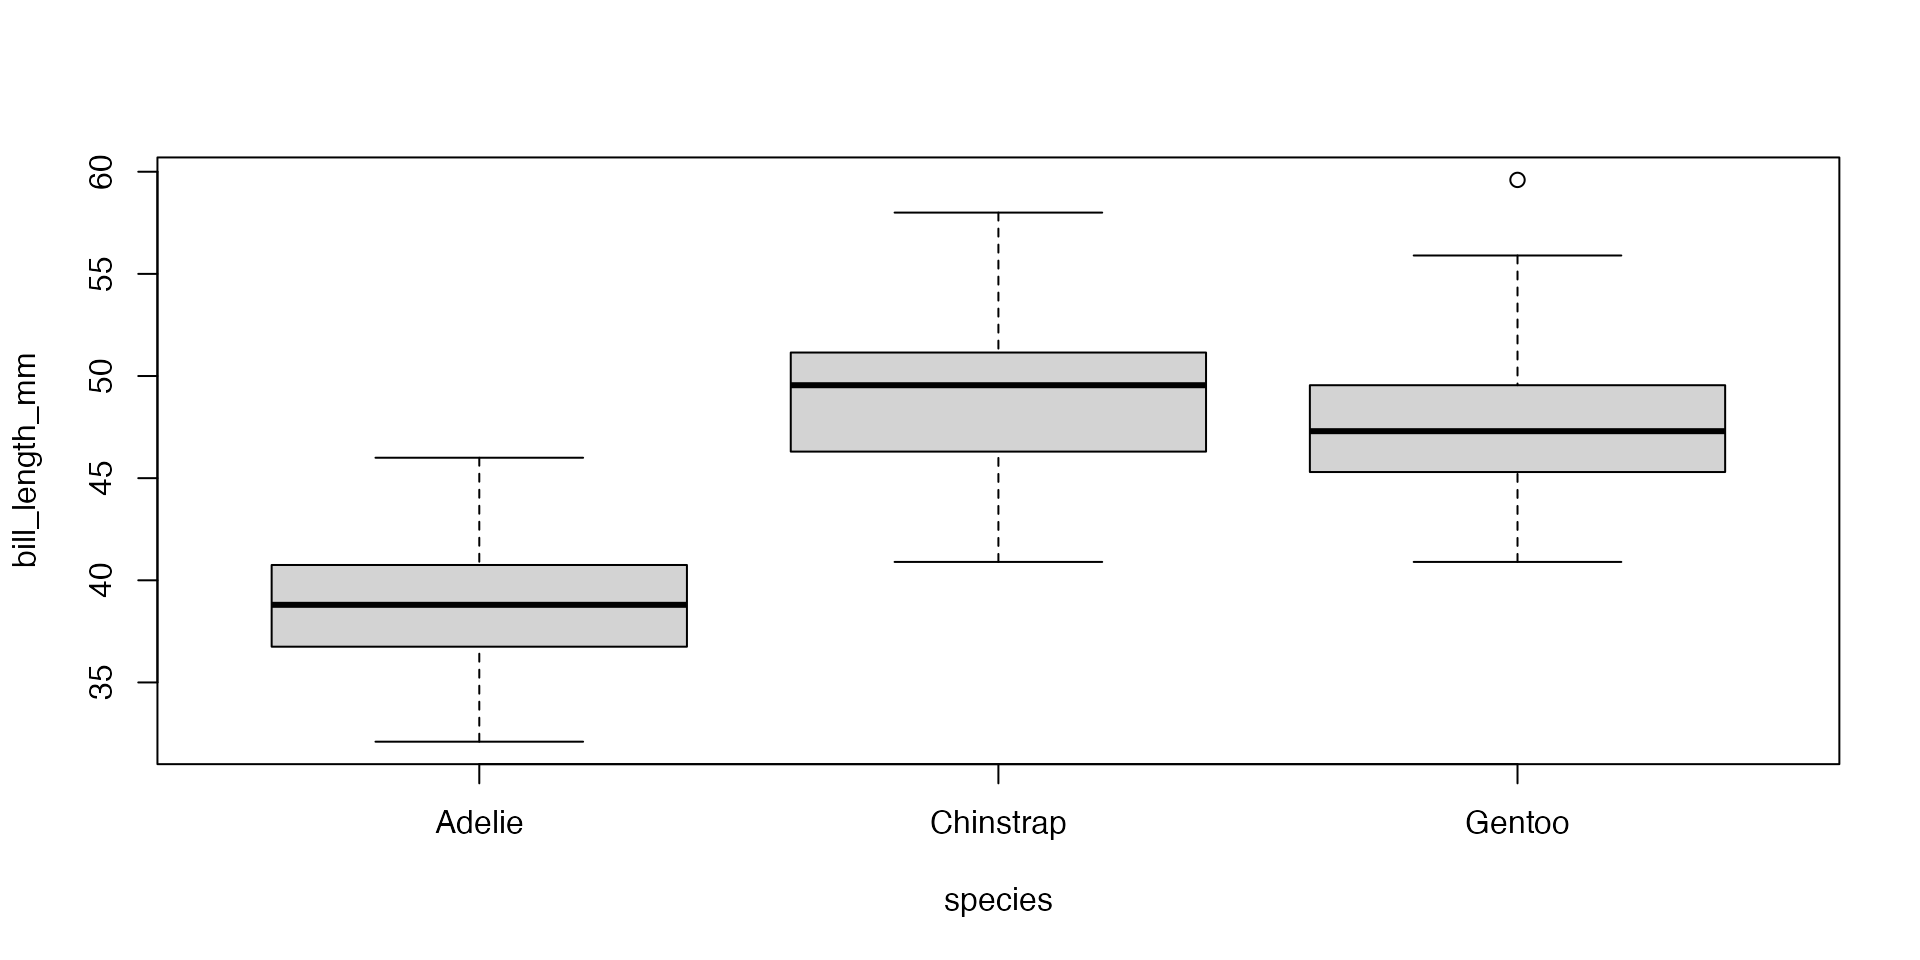
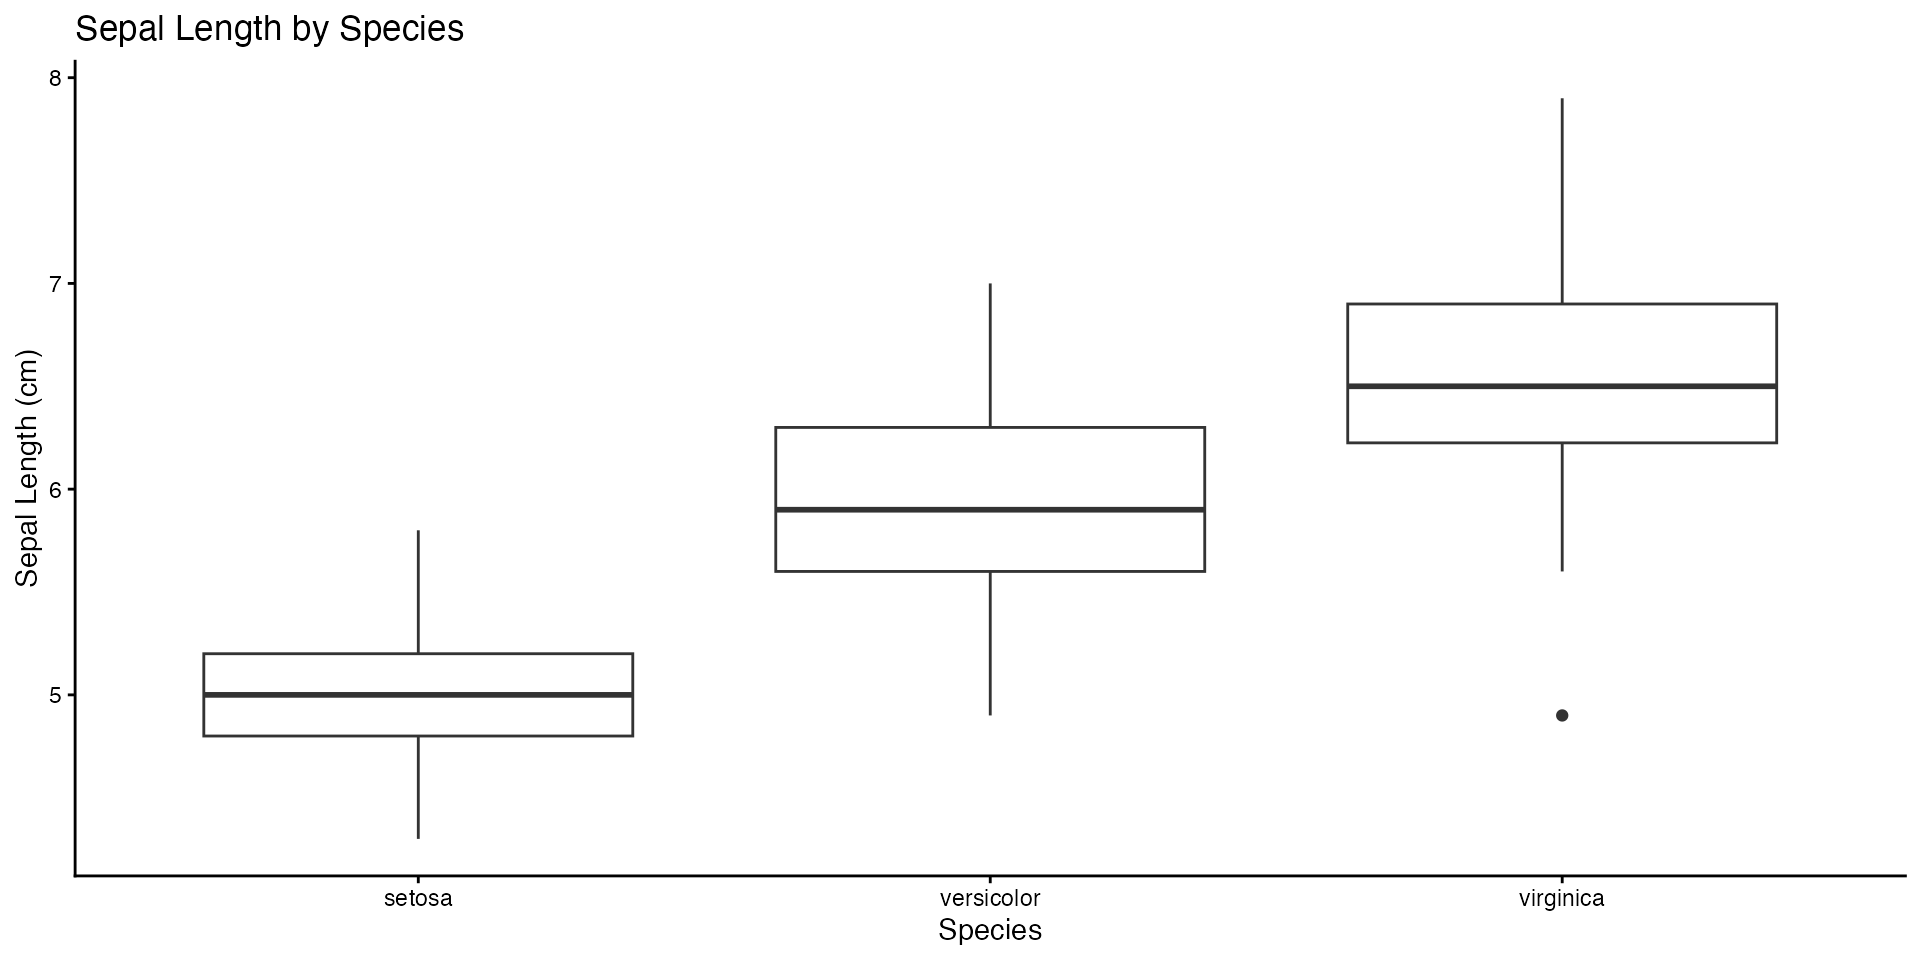
Which sepal length is longer?
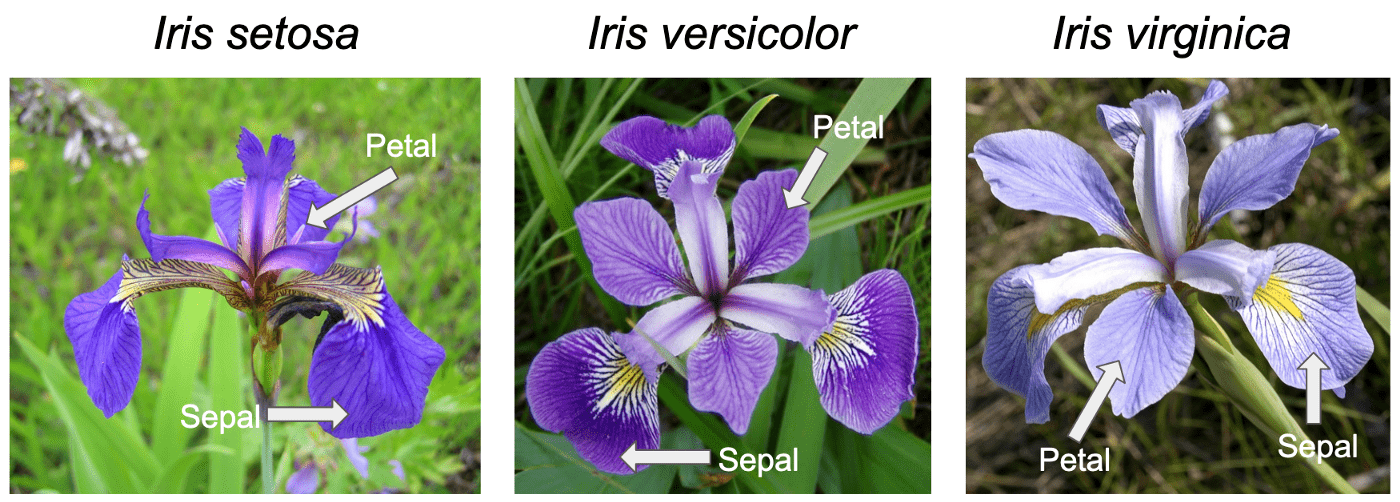
Source: Embedded Robotics
Note: common dataset used in statistics and machine learning.
Serious stats
Visualise
Not always formal
_Messi.jpg)
No single method
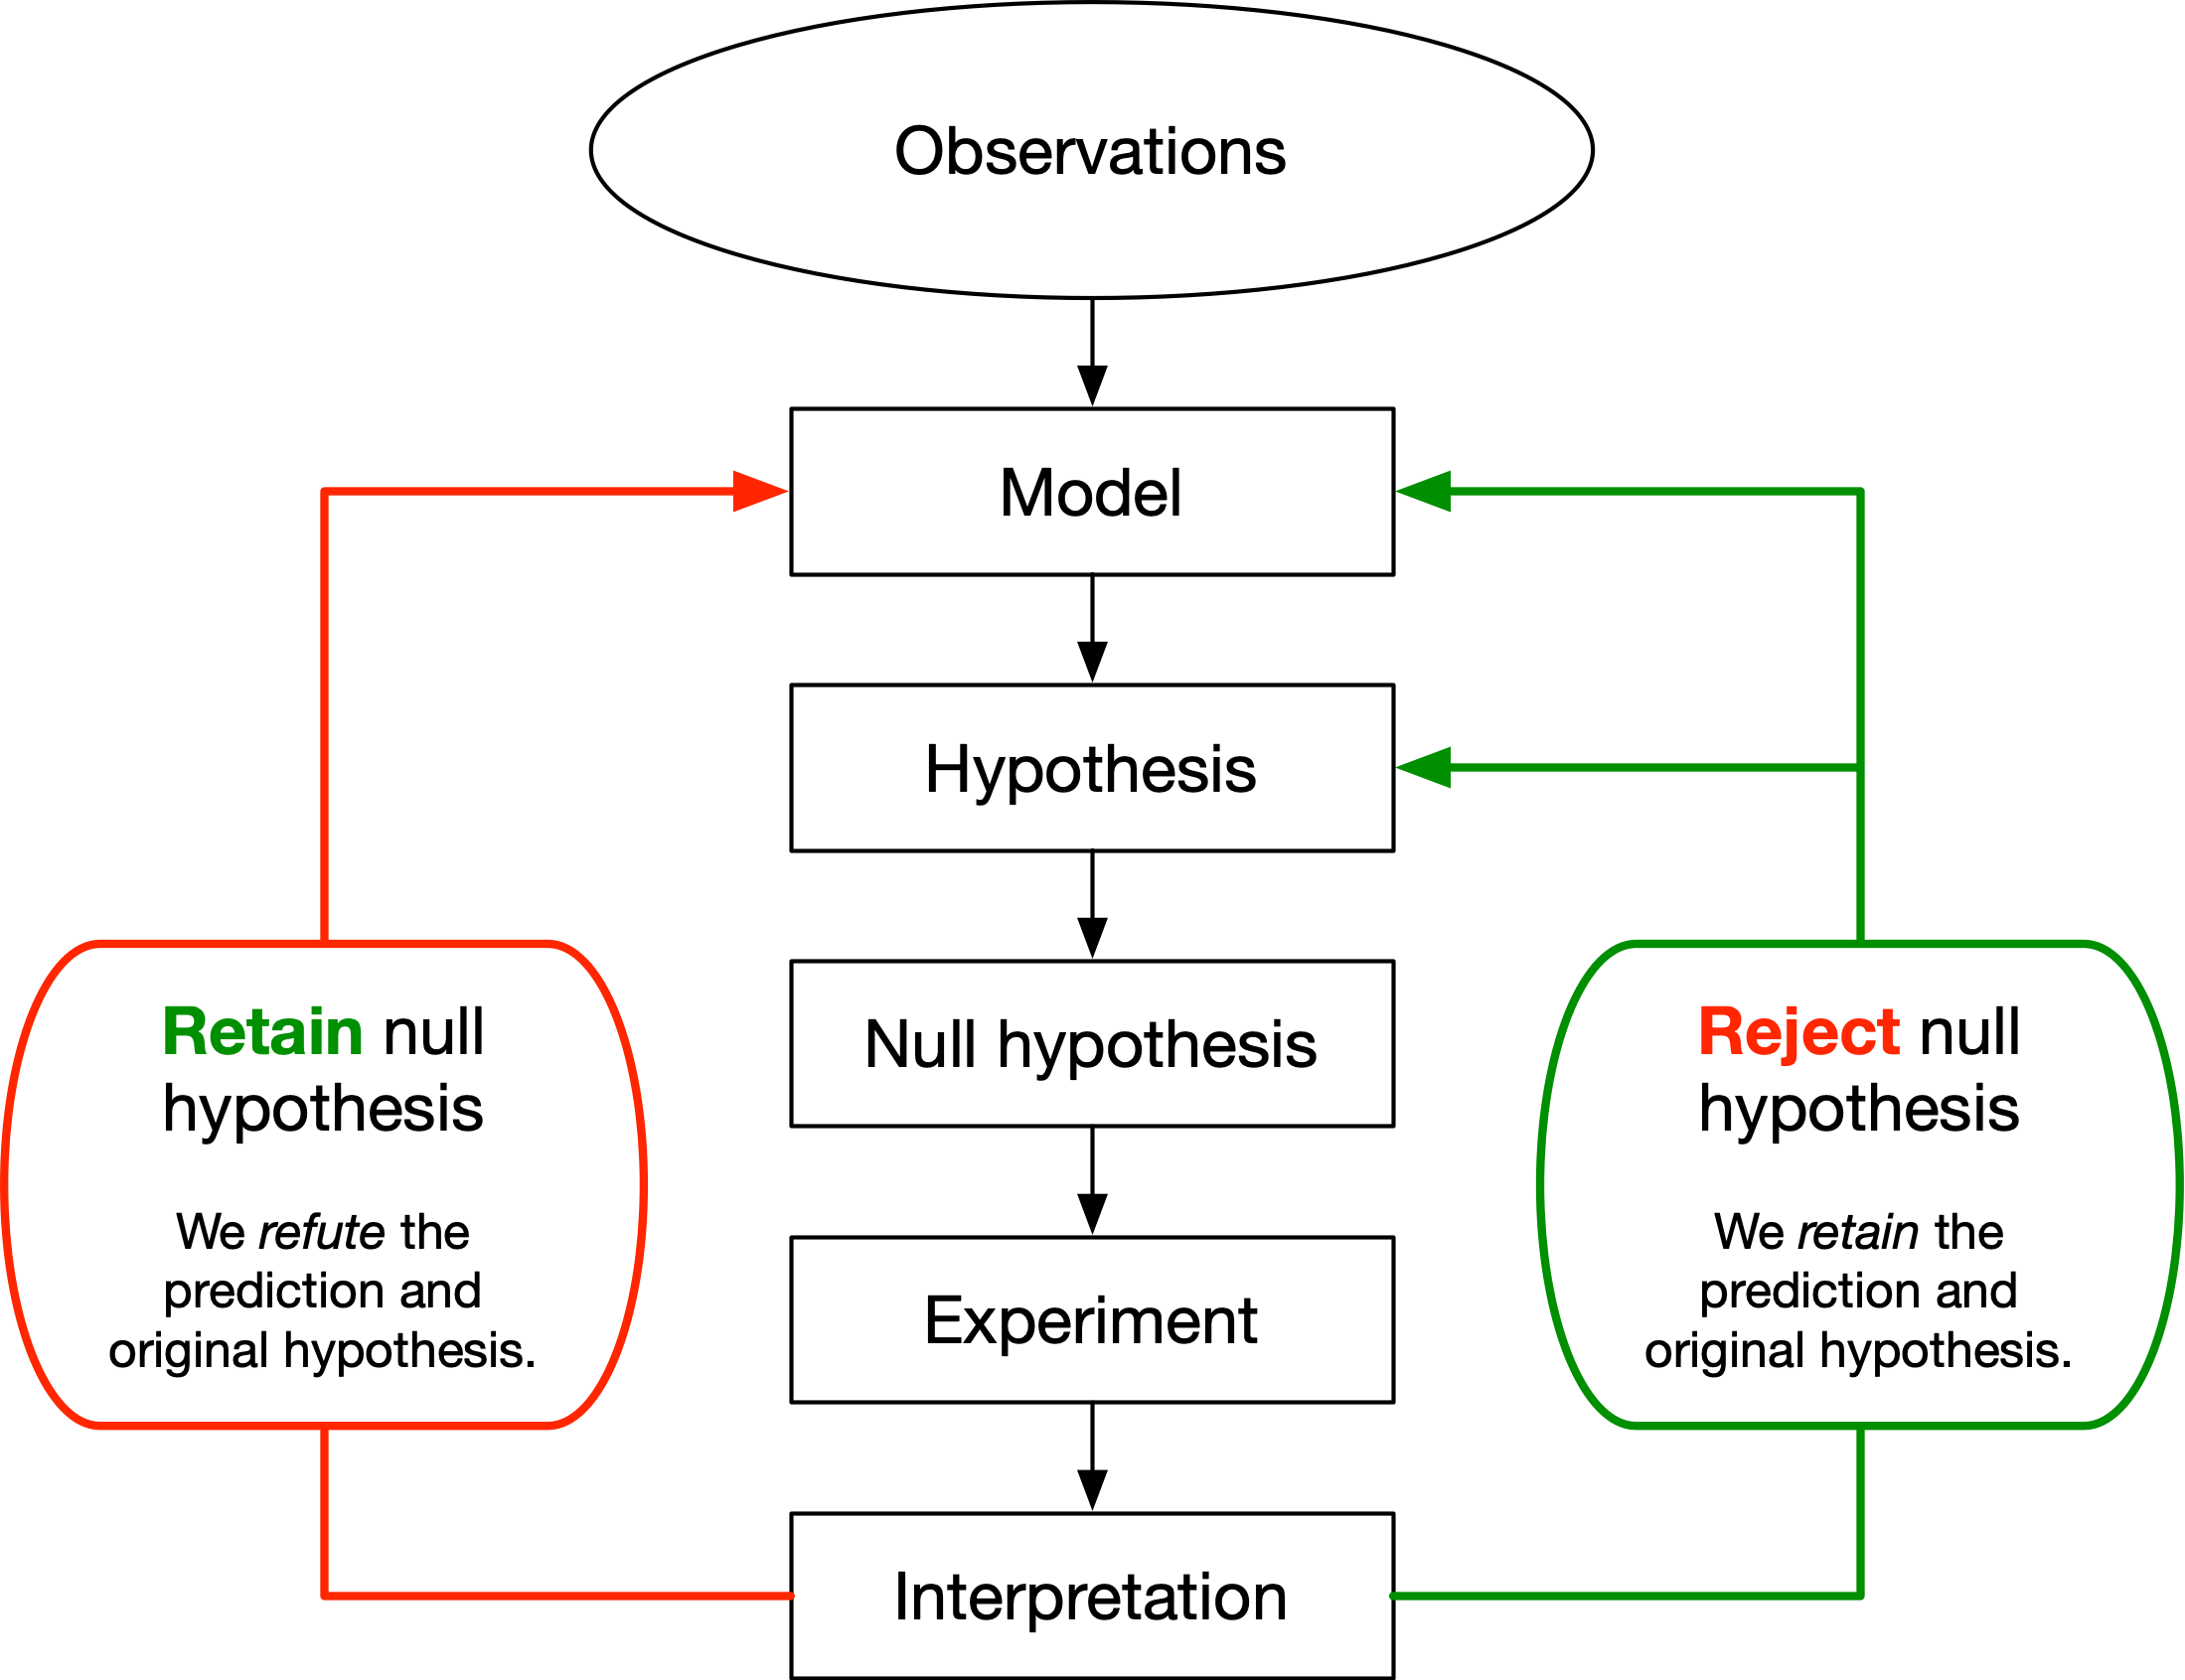
The logical framework by Underwood (1997)
No single method
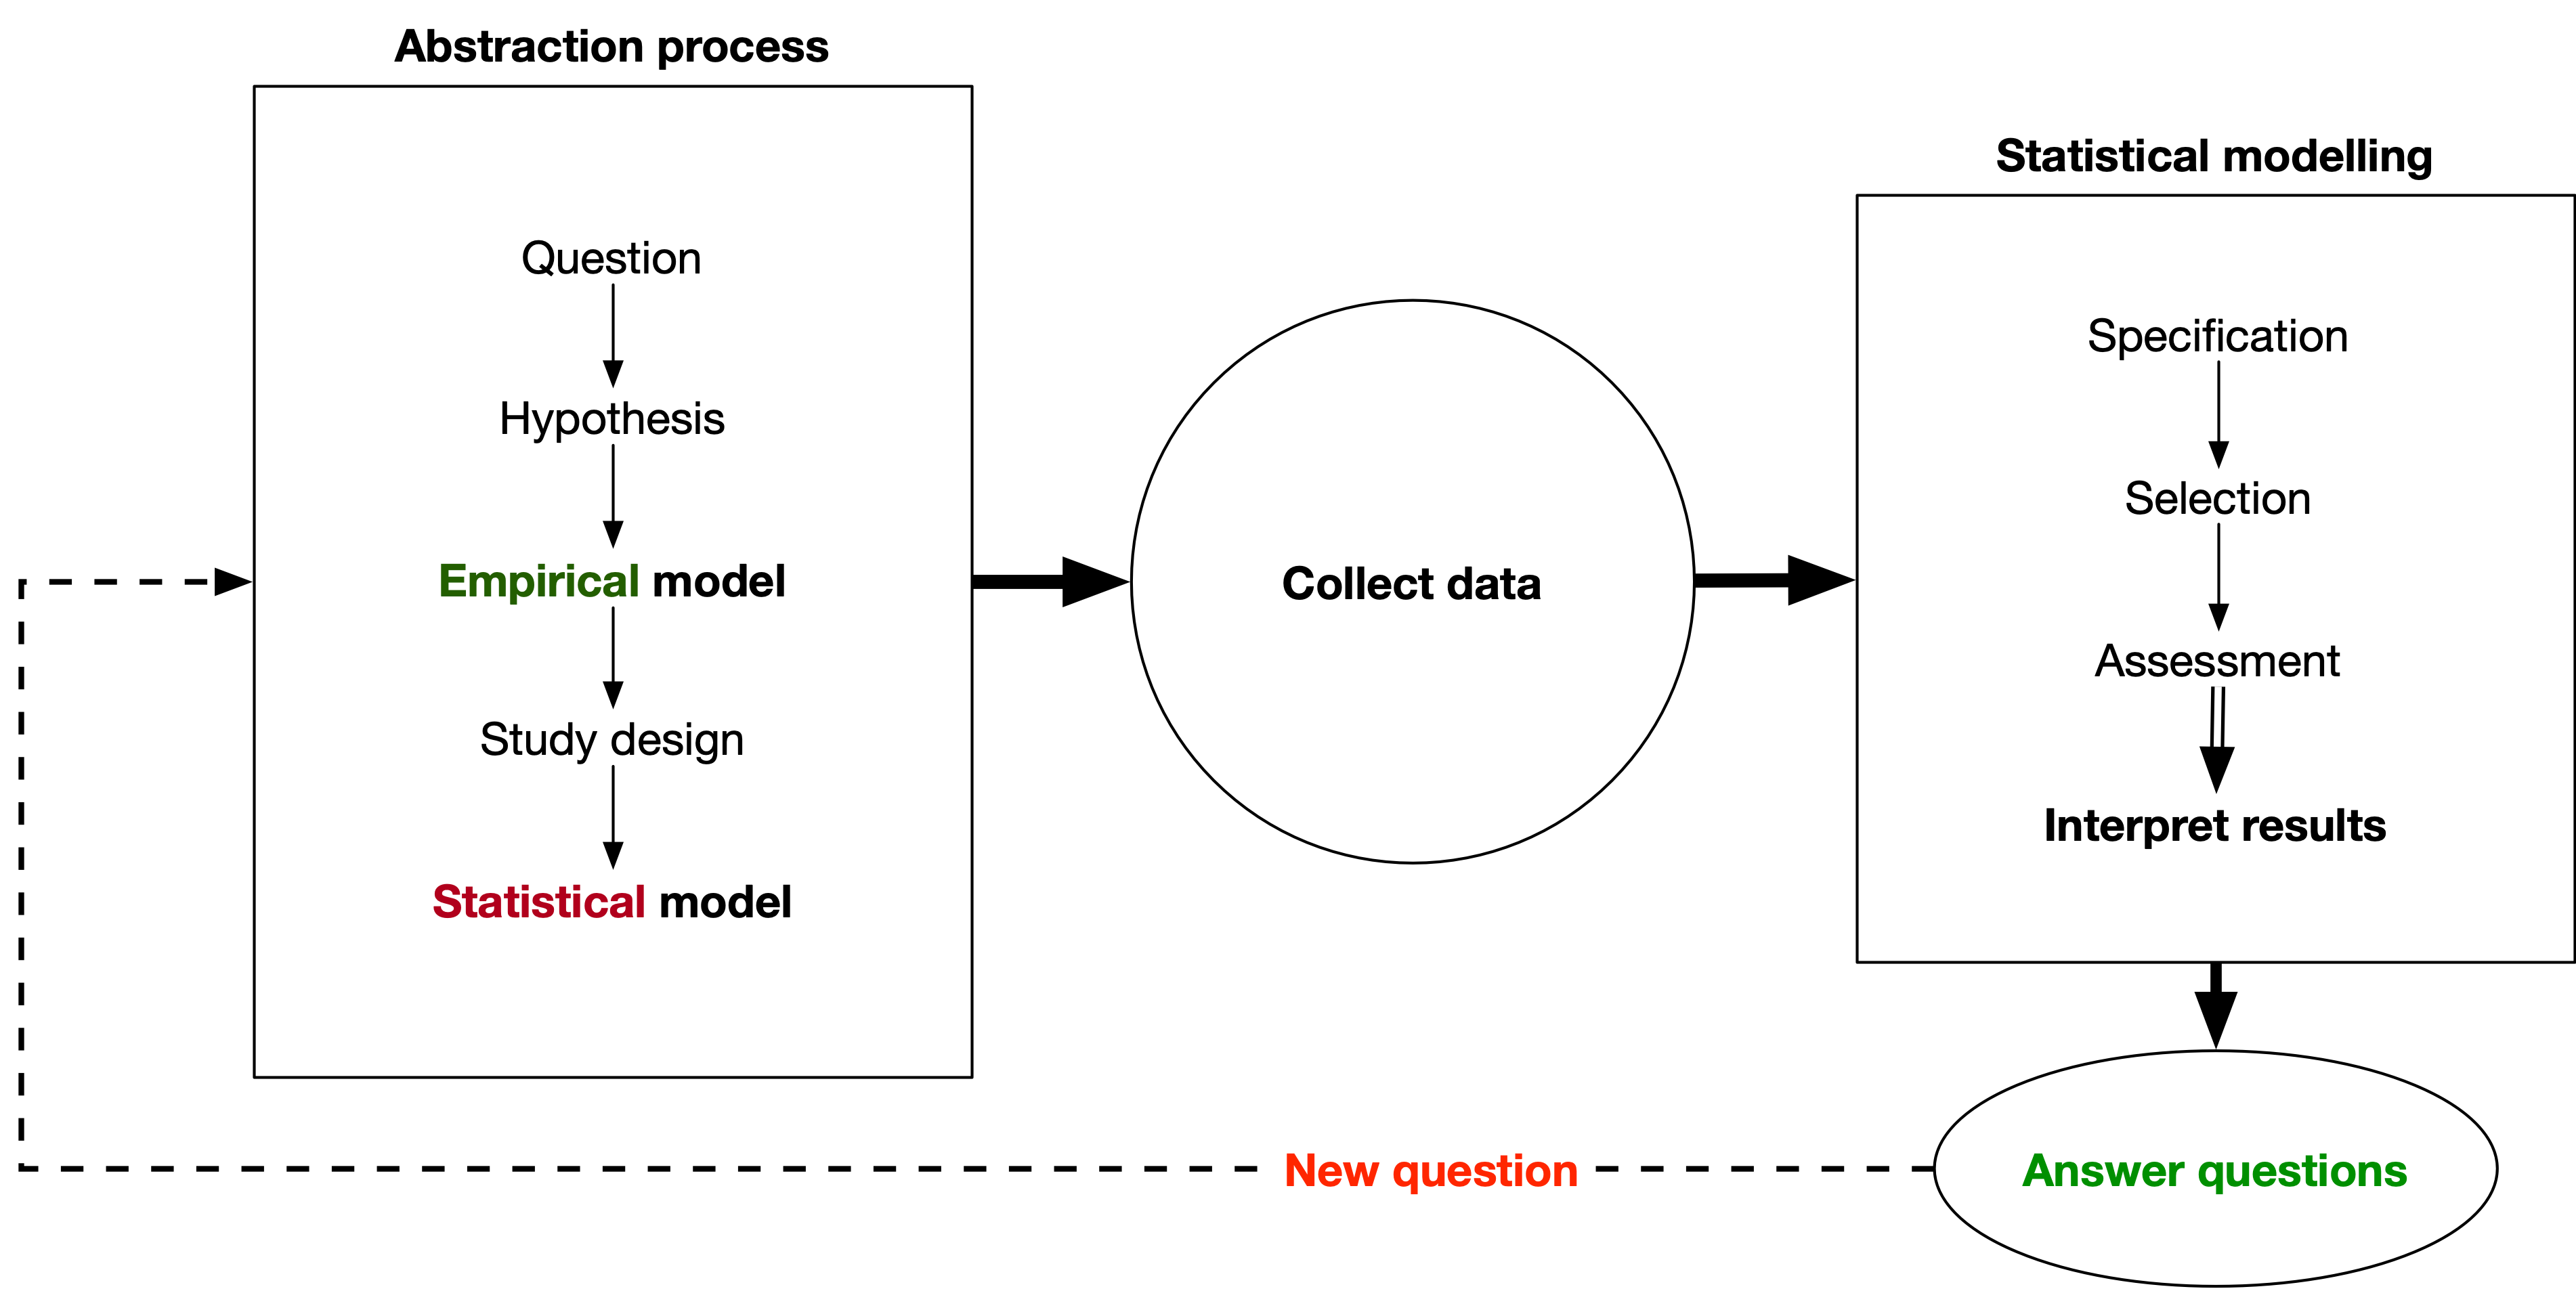
No single method
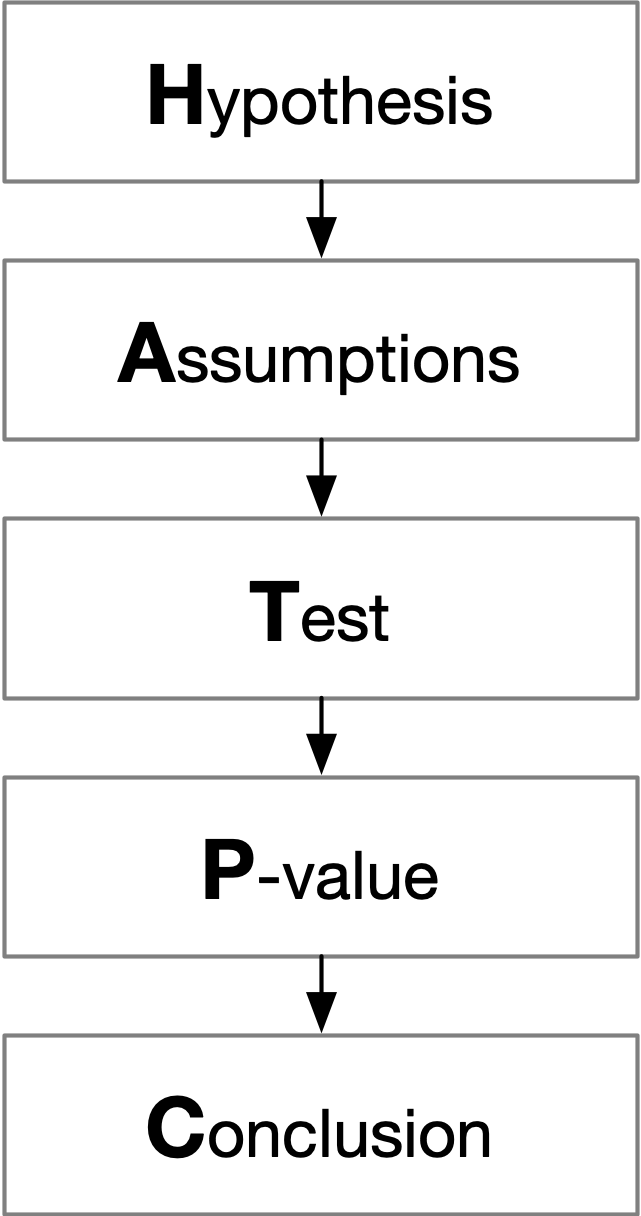
HATPC
- Hypothesis
- Assumptions
- Test statistic
- P-value
- Conclusion
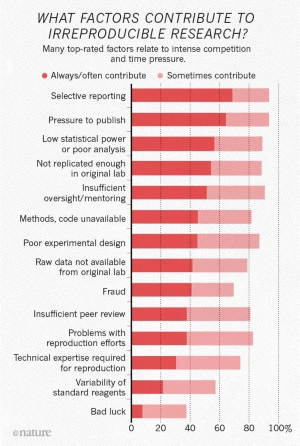
Reproducibility crisis
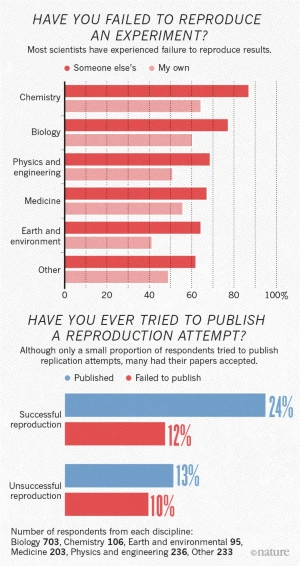
Reproducibility
How would you explain to someone how to reproduce this plot…

in Excel? Check the guide
In SPSS? Check the guide
In R