Call:
lm(formula = log(Ozone) ~ Temp + Solar.R + Wind, data = airquality)

Residuals:
     Min       1Q   Median       3Q      Max
-2.06193 -0.29970 -0.00231  0.30756  1.23578

Coefficients:
              Estimate Std. Error t value Pr(>|t|)
(Intercept) -0.2621323  0.5535669  -0.474 0.636798
Temp         0.0491711  0.0060875   8.077 1.07e-12 ***
Solar.R      0.0025152  0.0005567   4.518 1.62e-05 ***
Wind        -0.0615625  0.0157130  -3.918 0.000158 ***
---
Signif. codes:  0 '***' 0.001 '**' 0.01 '*' 0.05 '.' 0.1 ' ' 1

Residual standard error: 0.5086 on 107 degrees of freedom
  (42 observations deleted due to missingness)
Multiple R-squared:  0.6644,    Adjusted R-squared:  0.655
F-statistic: 70.62 on 3 and 107 DF, p-value: < 2.2e-16Regression: model development
ENVX2001 Applied Statistical Methods
Apr 2026
What happens when we add more predictors to a model?
A simple example using polynomial regression.
- The more predictors we include, the more variance we can explain.
- However, the more predictors and complexity we include, the more overfitted the model becomes.
Code
set.seed(1030)
xsquared <- function(x) {
  x^2
}
# Generate xy data
sim_data <- function(xsquared, sample_size = 100) {
  x <- runif(n = sample_size, min = 0, max = 1)
  y <- rnorm(n = sample_size, mean = xsquared(x), sd = 0.05)
  data.frame(x, y)
}
# Generate predicted data (model)
df <- sim_data(xsquared, sample_size = 60)
fit <- lm(y ~ 1, data = df)
fit_1 <- lm(y ~ poly(x, degree = 1), data = df)
fit_2 <- lm(y ~ poly(x, degree = 2), data = df)
fit_many <- lm(y ~ poly(x, degree = 20), data = df)
truth <- seq(from = 0, to = 1, by = 0.01)
# Combine the data and model fits into a single data frame
df <- data.frame(
  x = df$x,
  y = df$y,
  fit = predict(fit),
  fit_1 = predict(fit_1),
  fit_2 = predict(fit_2),
  fit_many = predict(fit_many)
)

# Reshape the data frame into long format
df_long <- pivot_longer(
  df,
  cols = starts_with("fit_"),
  names_to = "model",
  values_to = "value"
) %>%
  mutate(
    model = case_when(
      model == "fit" ~ "y = b",
      model == "fit_1" ~ "y = b + mx",
      model == "fit_2" ~ "y = b + mx + nx^2",
      model == "fit_many" ~ "y = b + mx + nx^2 + ... + zx^20",
      TRUE ~ model
    )
  )
# Plot
p <- ggplot(df_long, aes(x = x, y = value, color = model)) +
  facet_wrap(~model, ncol = 2, scales = "free") +
  geom_point(aes(y = y), alpha = .4, size = 2) +
  geom_line(linewidth = .9, linetype = 1) +
  scale_color_brewer(palette = "Set1") +
  theme(legend.position = "none") +
  geom_blank()
p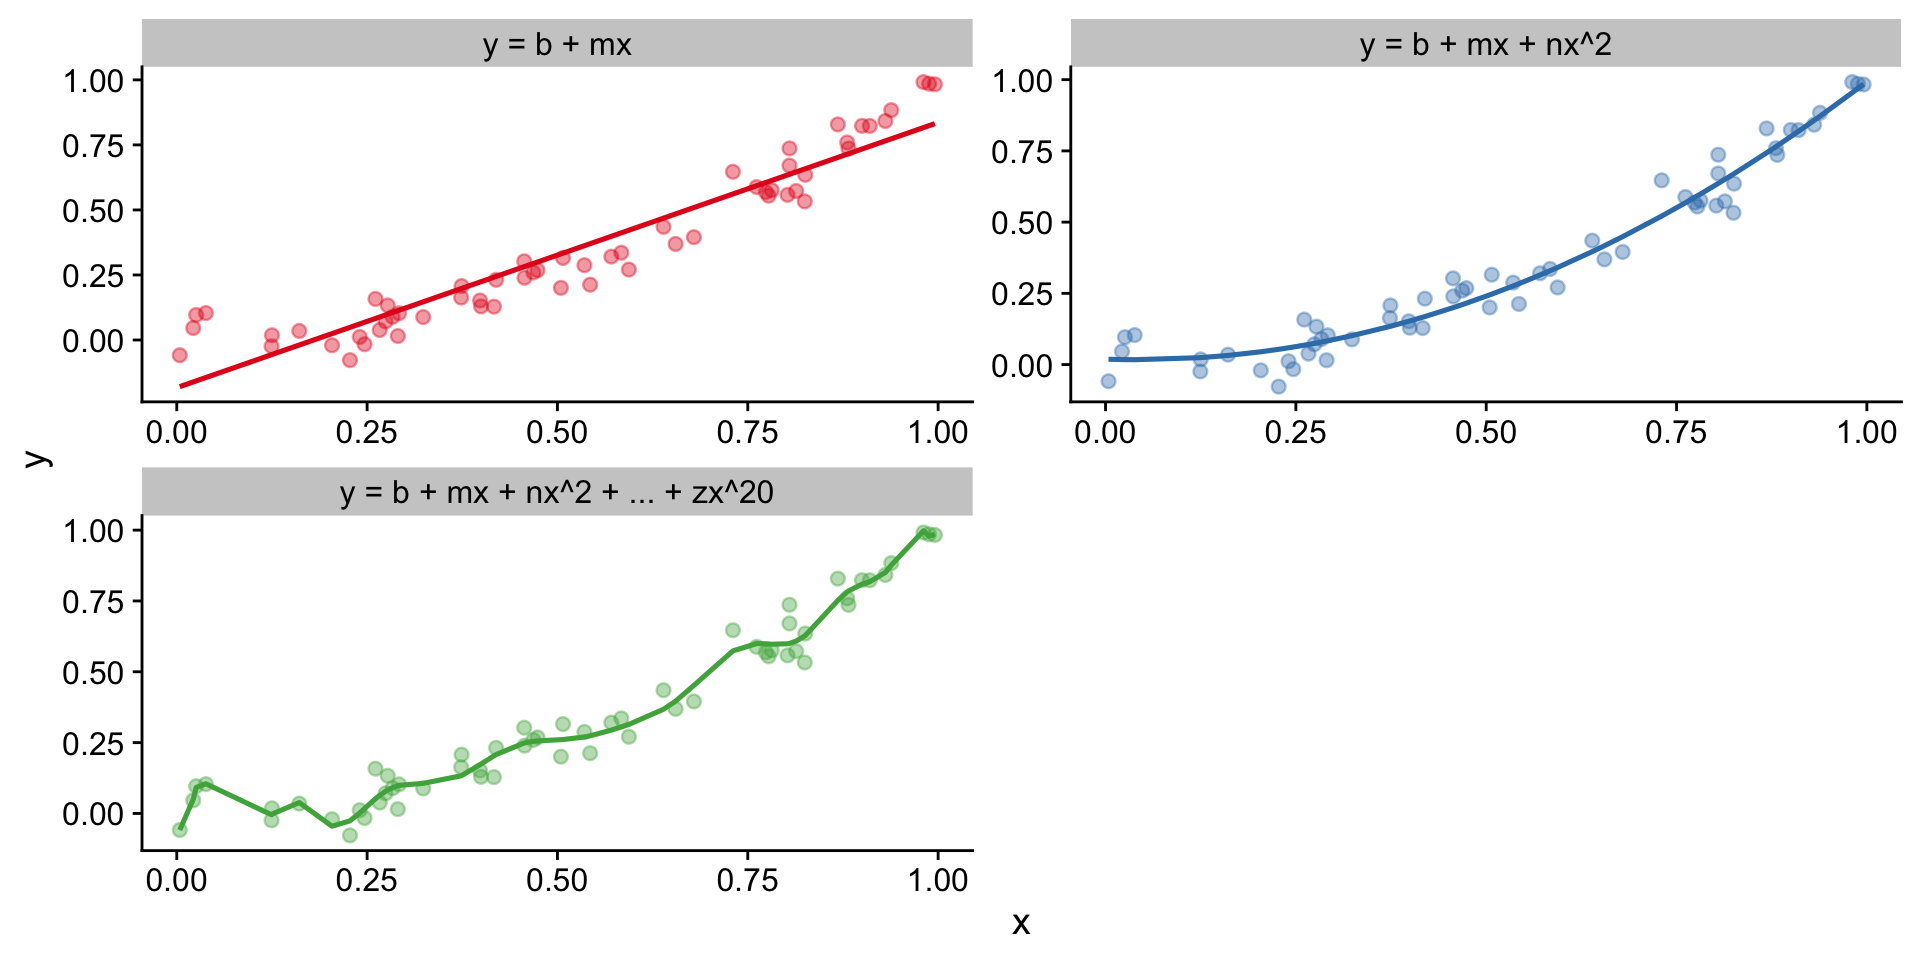
Variance-bias trade-off

In concept…
- As complexity increases, bias (\(\sum{O-\bar{P}}\)) decreases (the mean of a model’s predictions is closer to the true mean).
- As complexity increases, prediction variance (\(\frac{\sum{(P-\bar{P})}^2}{n}\)) increases.
- The goal is to find a model that isn’t too simple or complex with a good balance between bias and variance.
\[ \text{Mean Squared Error} = \text{Bias}^2 + \text{Variance} + \text{Immeasureable Error} \] In practice, the math and relationships are a bit more irregular.
Data exploration
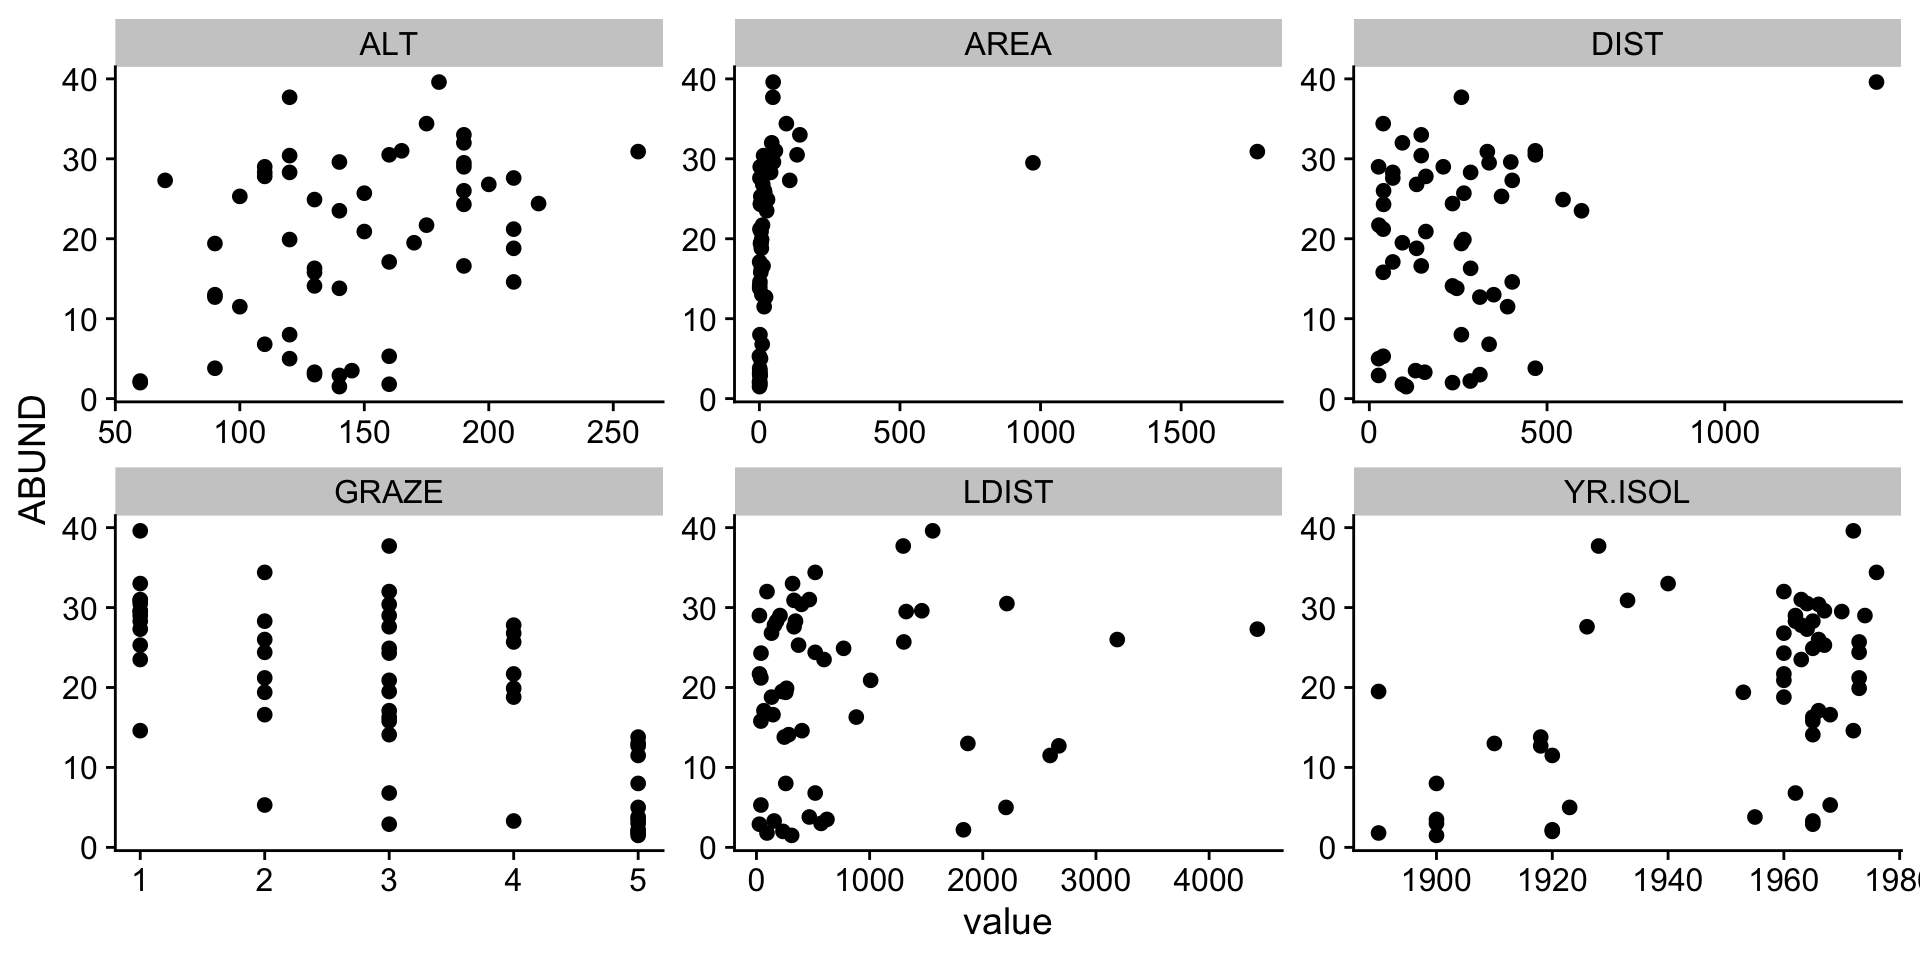
- The predictors are on very different scales, which can cause problems for the model.
- The relationships don’t look particularly linear…and outliers.
- We will perform log10 transforms of
AREA,LDIST, andDIST.
Log10 transformation
Code
# perform transformations
loyn <- loyn %>%
  mutate(AREA_L10 = log10(AREA),
         LDIST_L10 = log10(LDIST),
         DIST_L10 = log10(DIST))

# View distributions again
loyn %>%
  select(-ALT, -GRAZE, -YR.ISOL) %>%
  pivot_longer(-ABUND) %>%
  mutate(name = factor(name, levels = unique(name))) %>%  # Preserve original order
  ggplot(aes(x = value, y = ABUND)) +
  geom_point() +
  facet_wrap(~name, scales = "free") +
  labs(y = "ABUND")
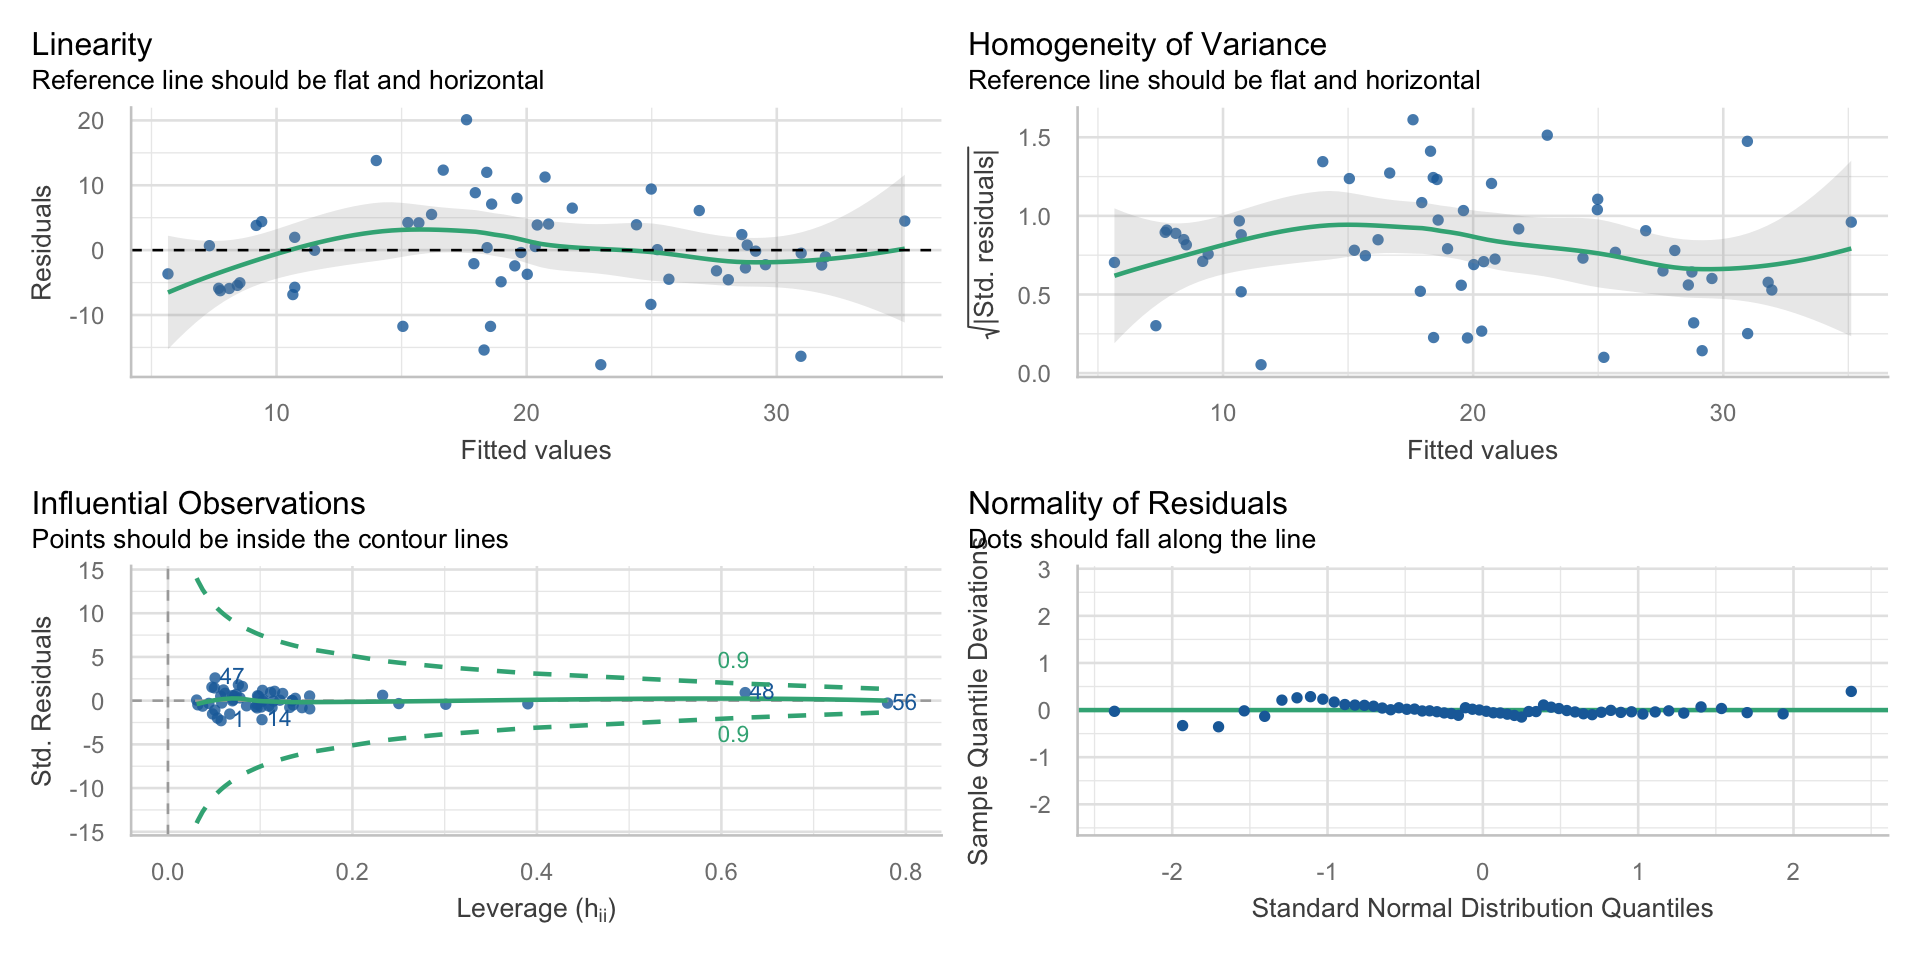
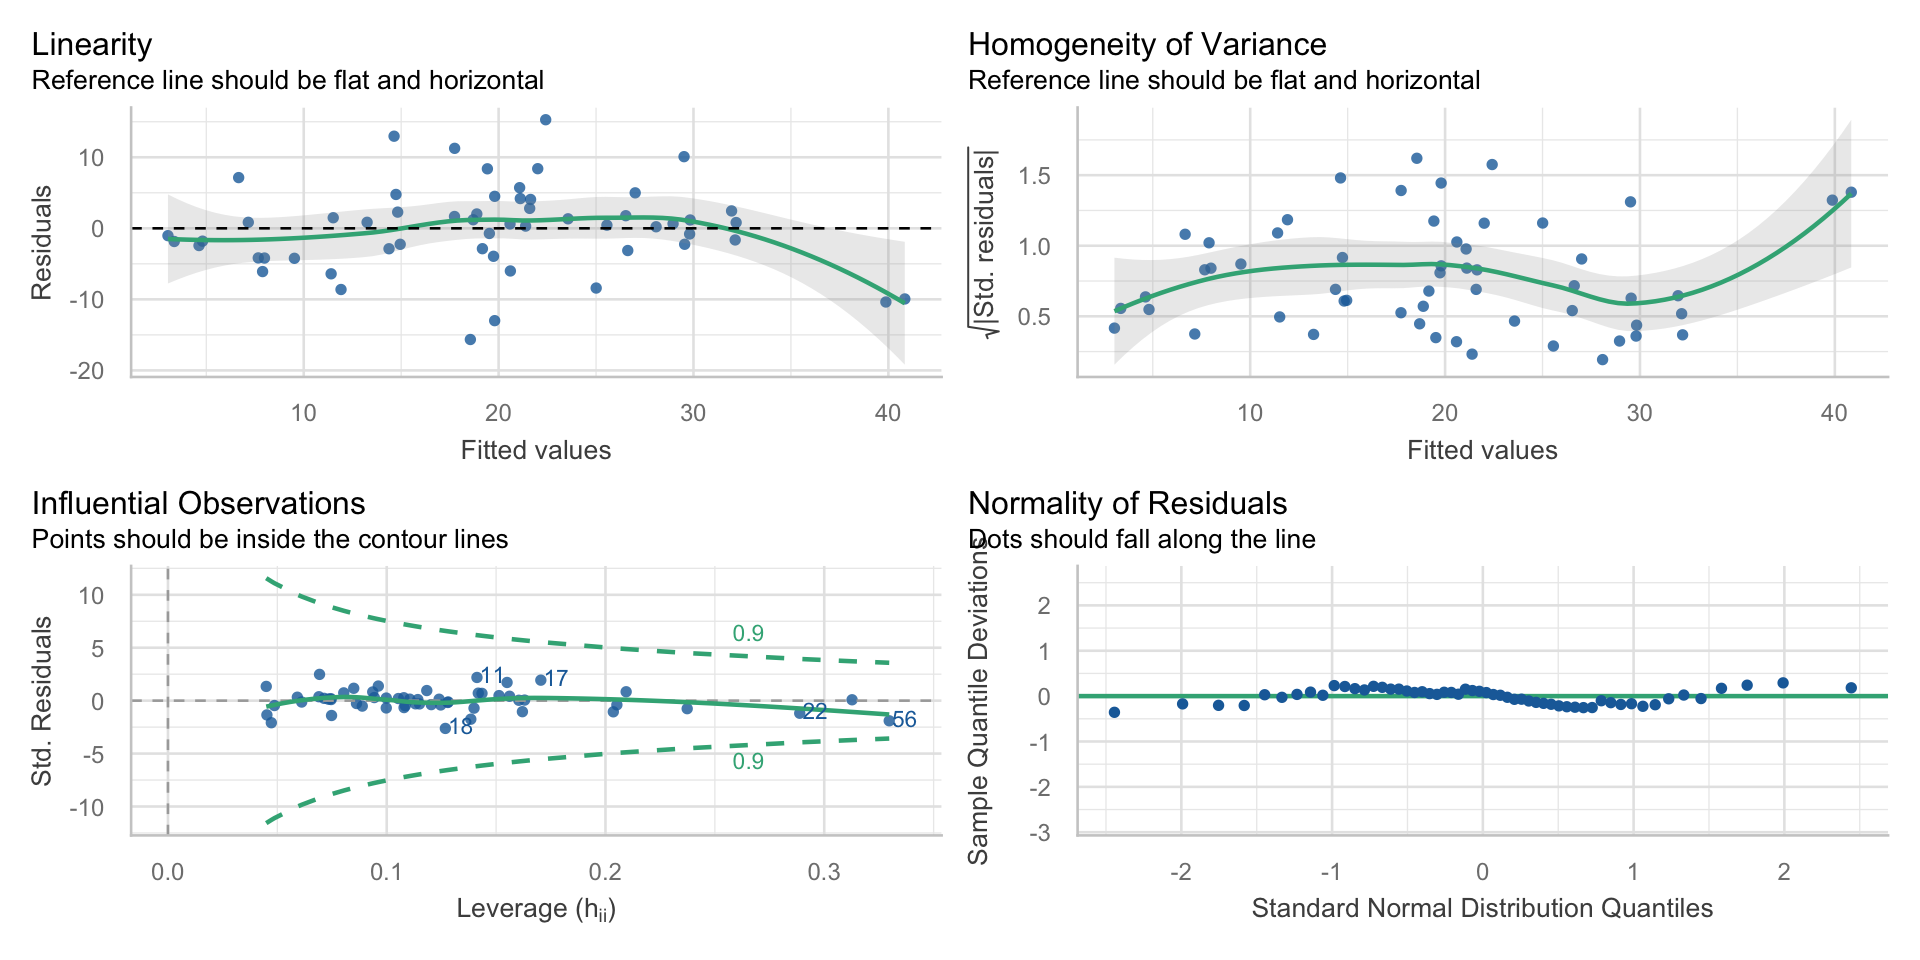
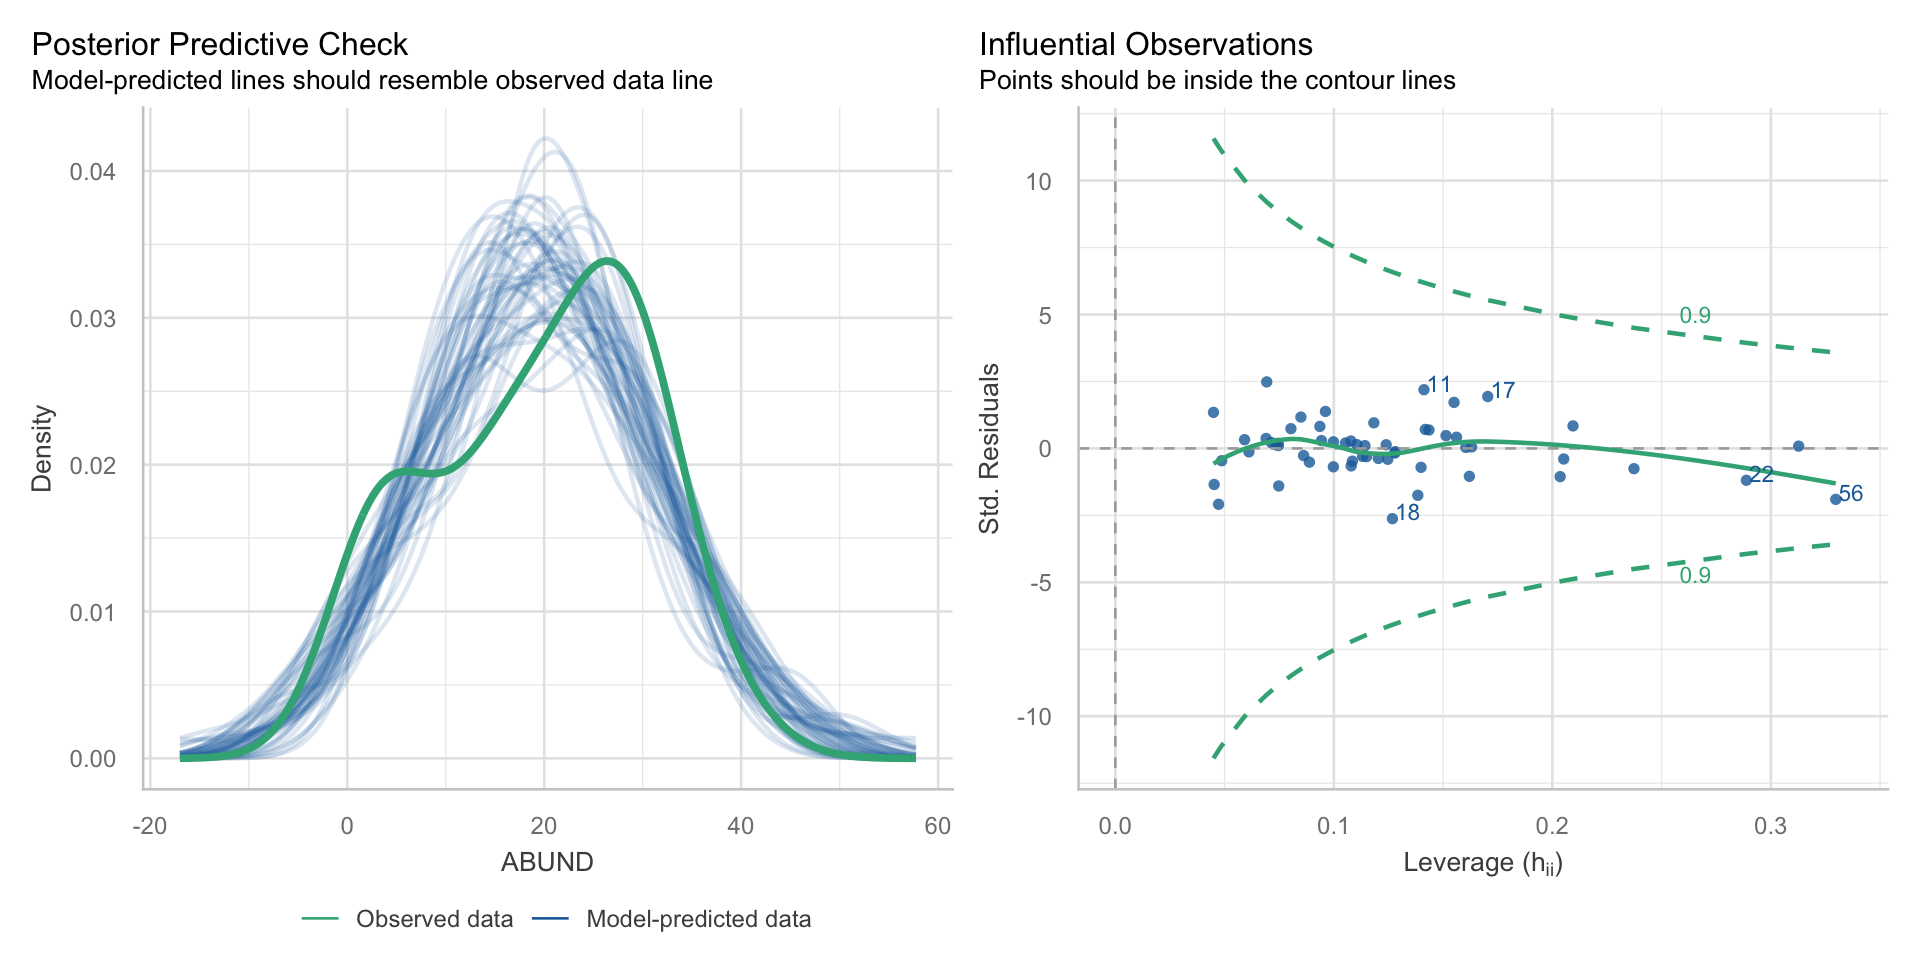
Reading the leverage plot
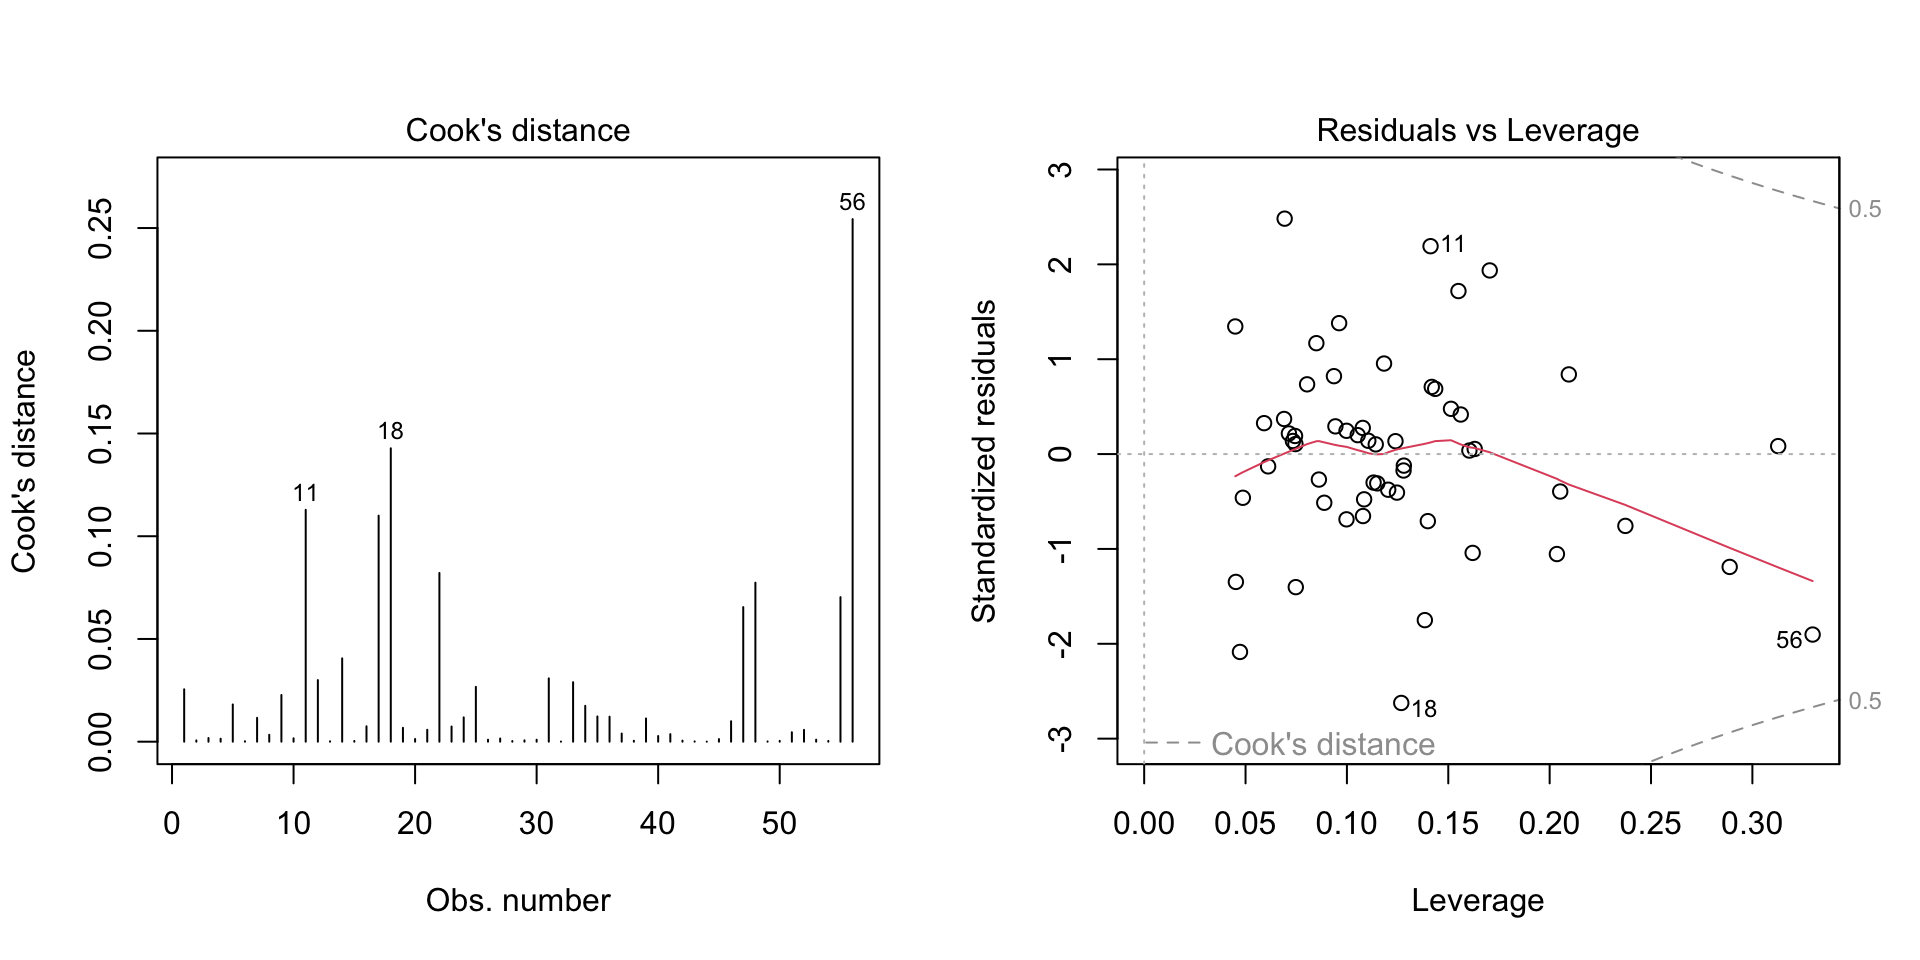
- Visually, points with Cook’s distance > 0.5 are considered influential by default, but this is a somewhat arbitrary threshold.
- In practice, you should use a threshold that is appropriate for your data and model.
Outlier detection using performance
Collinearity
- Two predictors that have a perfect linear relationship (i.e. \(r\) = 1 or -1) breaks the assumption of collinearity
- Even strong correlations between predictors can lead to unstable estimates and large standard errors.
- Variance inflation factors (VIFs) are a measure of collinearity in the model.
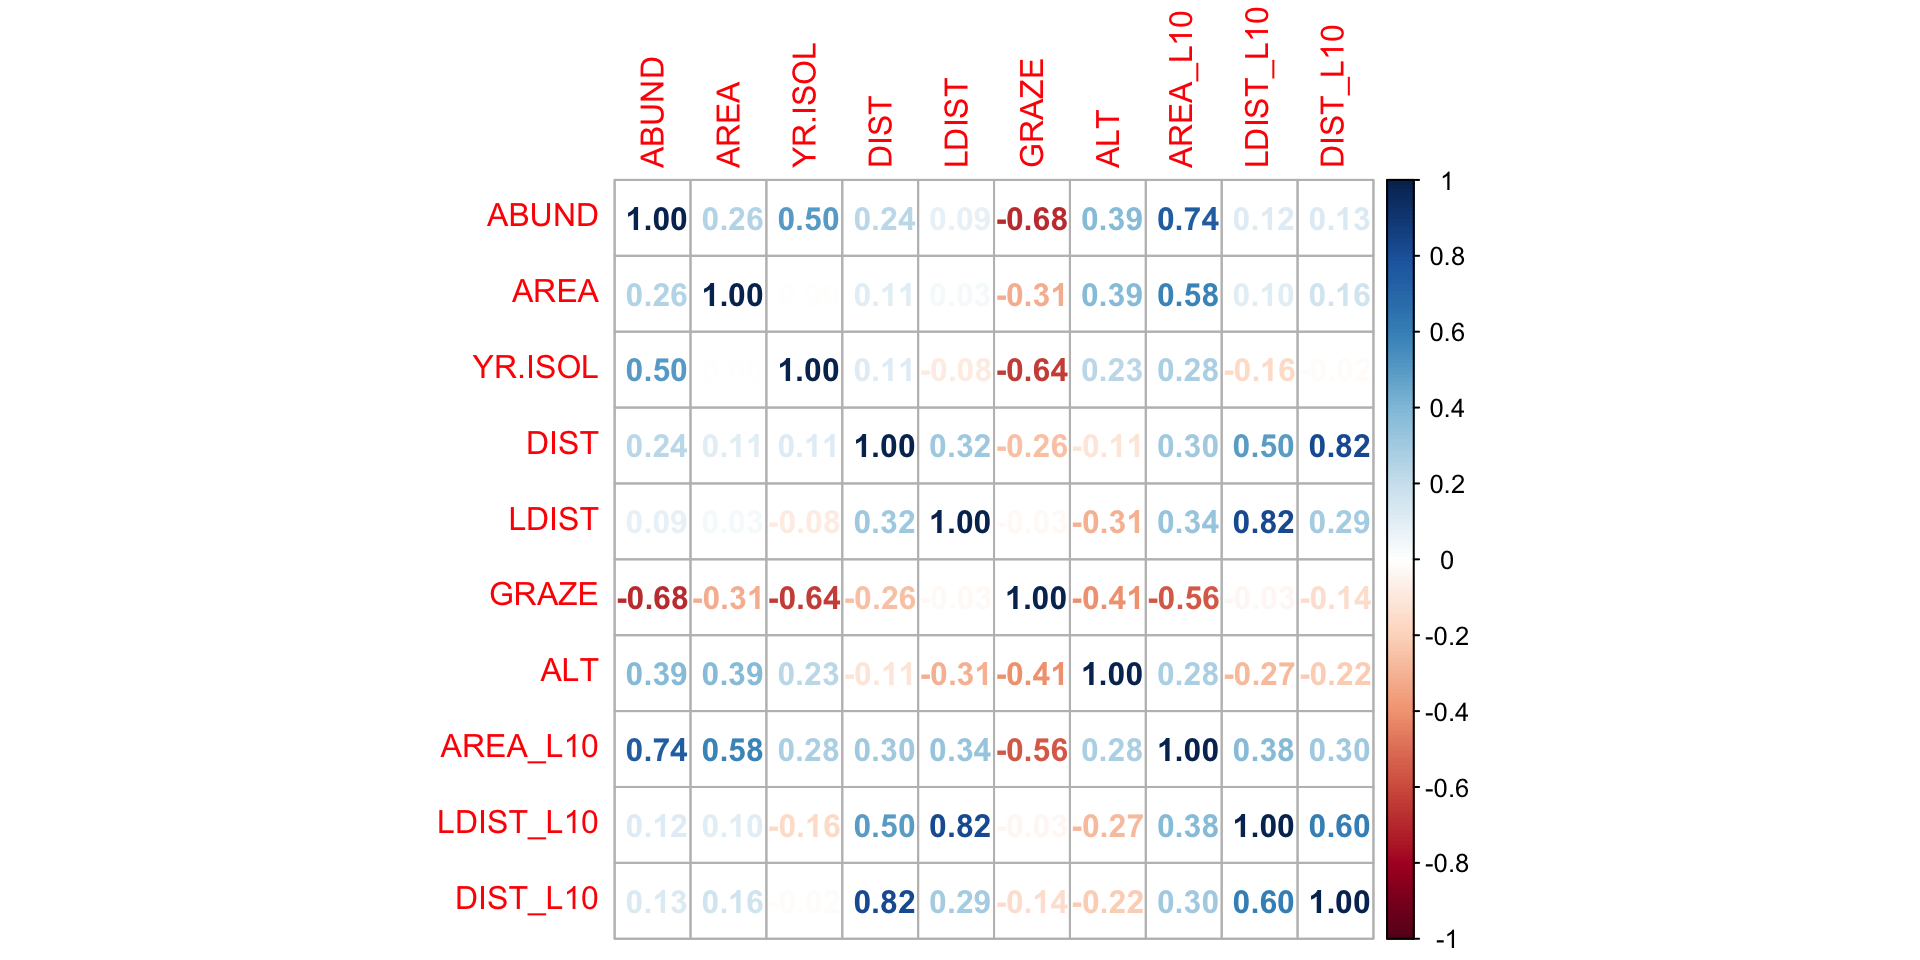
Calculating VIF
  YR.ISOL     GRAZE       ALT  AREA_L10 LDIST_L10  DIST_L10
1.80 2.52 1.47 1.91 2.01 1.65 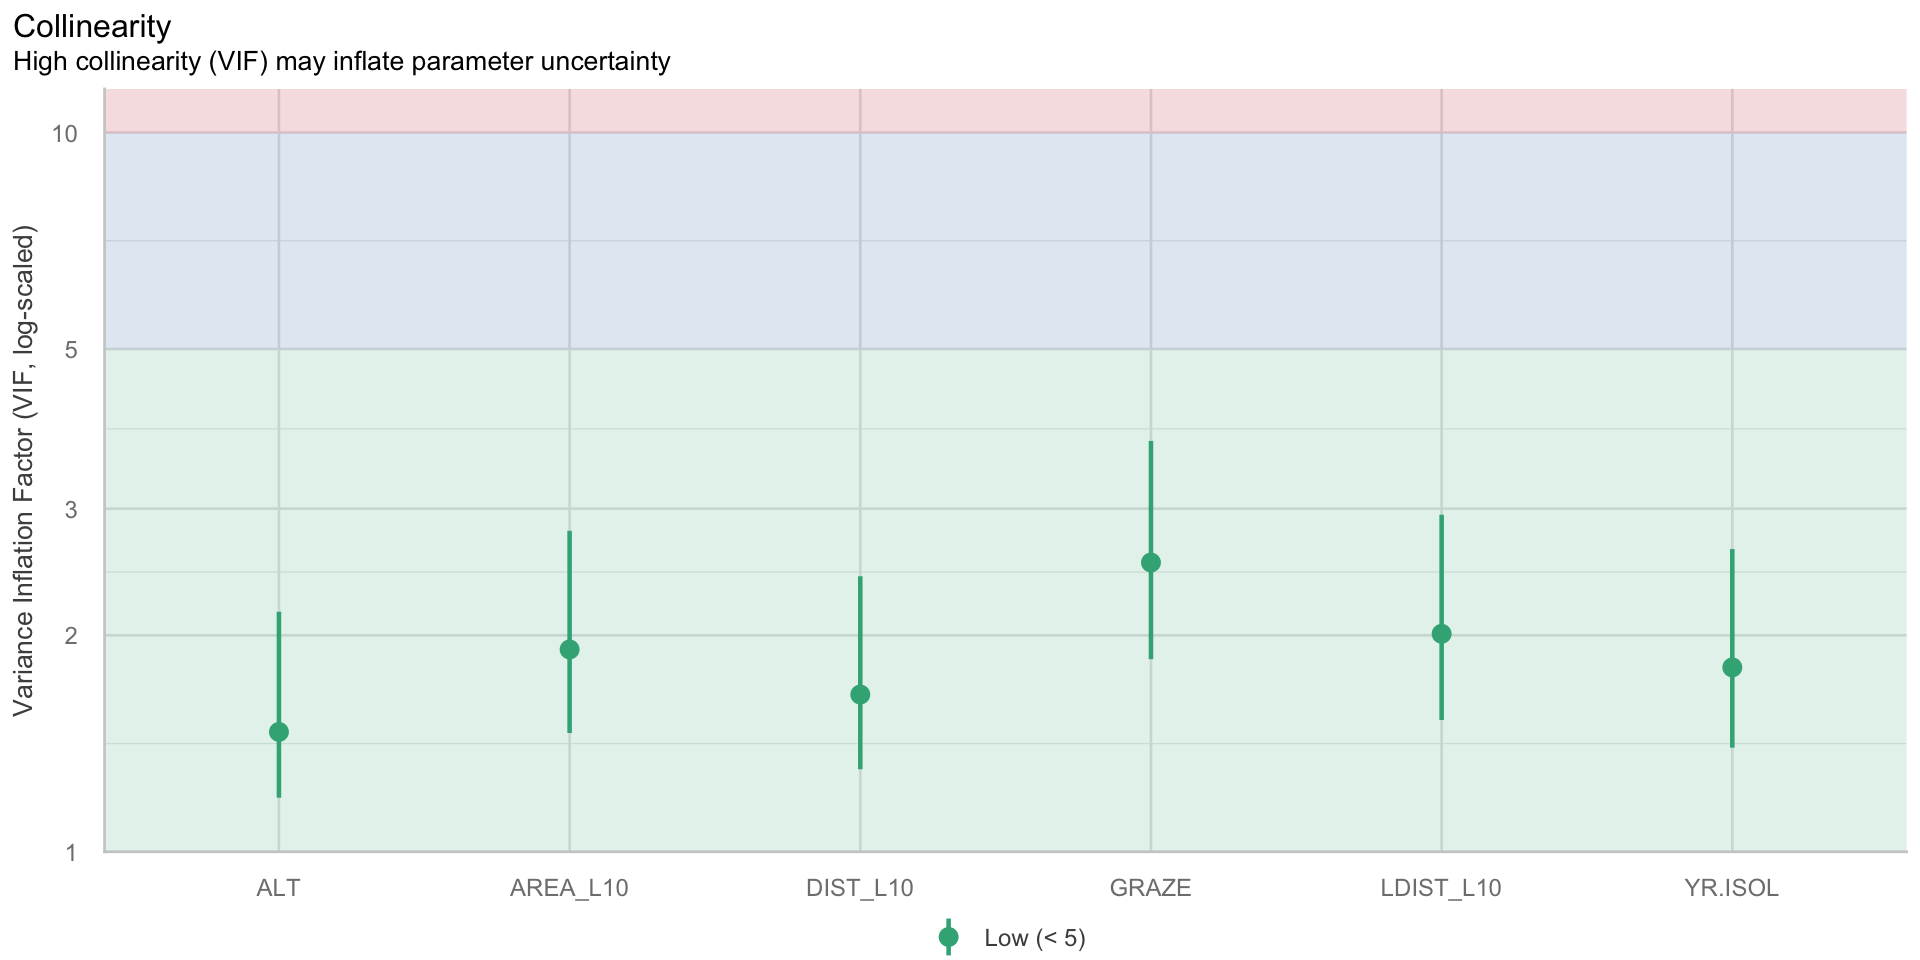
- \(1\) = no correlation with other predictors.
- \(>10\) is a sign for high, not tolerable correlation of model predictors (which need to be removed and the model refitted).