Introduction to statistics
Welcome to ENVX1002! This unit introduces you to essential statistical methods that will help you understand and analyse data, regardless of your field of study. Whether you’re studying environmental science, agriculture, veterinary science, or any other discipline, the skills you’ll learn here will help you make sense of data and draw meaningful conclusions from it.
Learning objectives
By the end of this unit, you will be able to:
- Understand different types of data and when to use them
- Use R and Excel for basic data analysis
- Apply appropriate statistical methods to answer research questions
- Create clear visualisations of your findings
- Interpret and communicate statistical results confidently
The above are, of course, simplified for your convenience. The actual learning objectives are more detailed and you can find them in the unit outline.
What is ENVX1002?
ENVX1002 is about learning to use statistical and computing methods to answer quantitative questions. It combines three key elements:
- Applied statistics: Tools and methods to analyse data
- Data analysis: Practical skills to process and understand information
- Research methods: Approaches to answer scientific questions

Introduction to research
The University of Sydney has a strong research tradition, and throughout your degree, you’ll have opportunities to engage with research in your chosen field. This unit will equip you with the fundamental skills needed to understand and conduct research, regardless of your specific area of study.
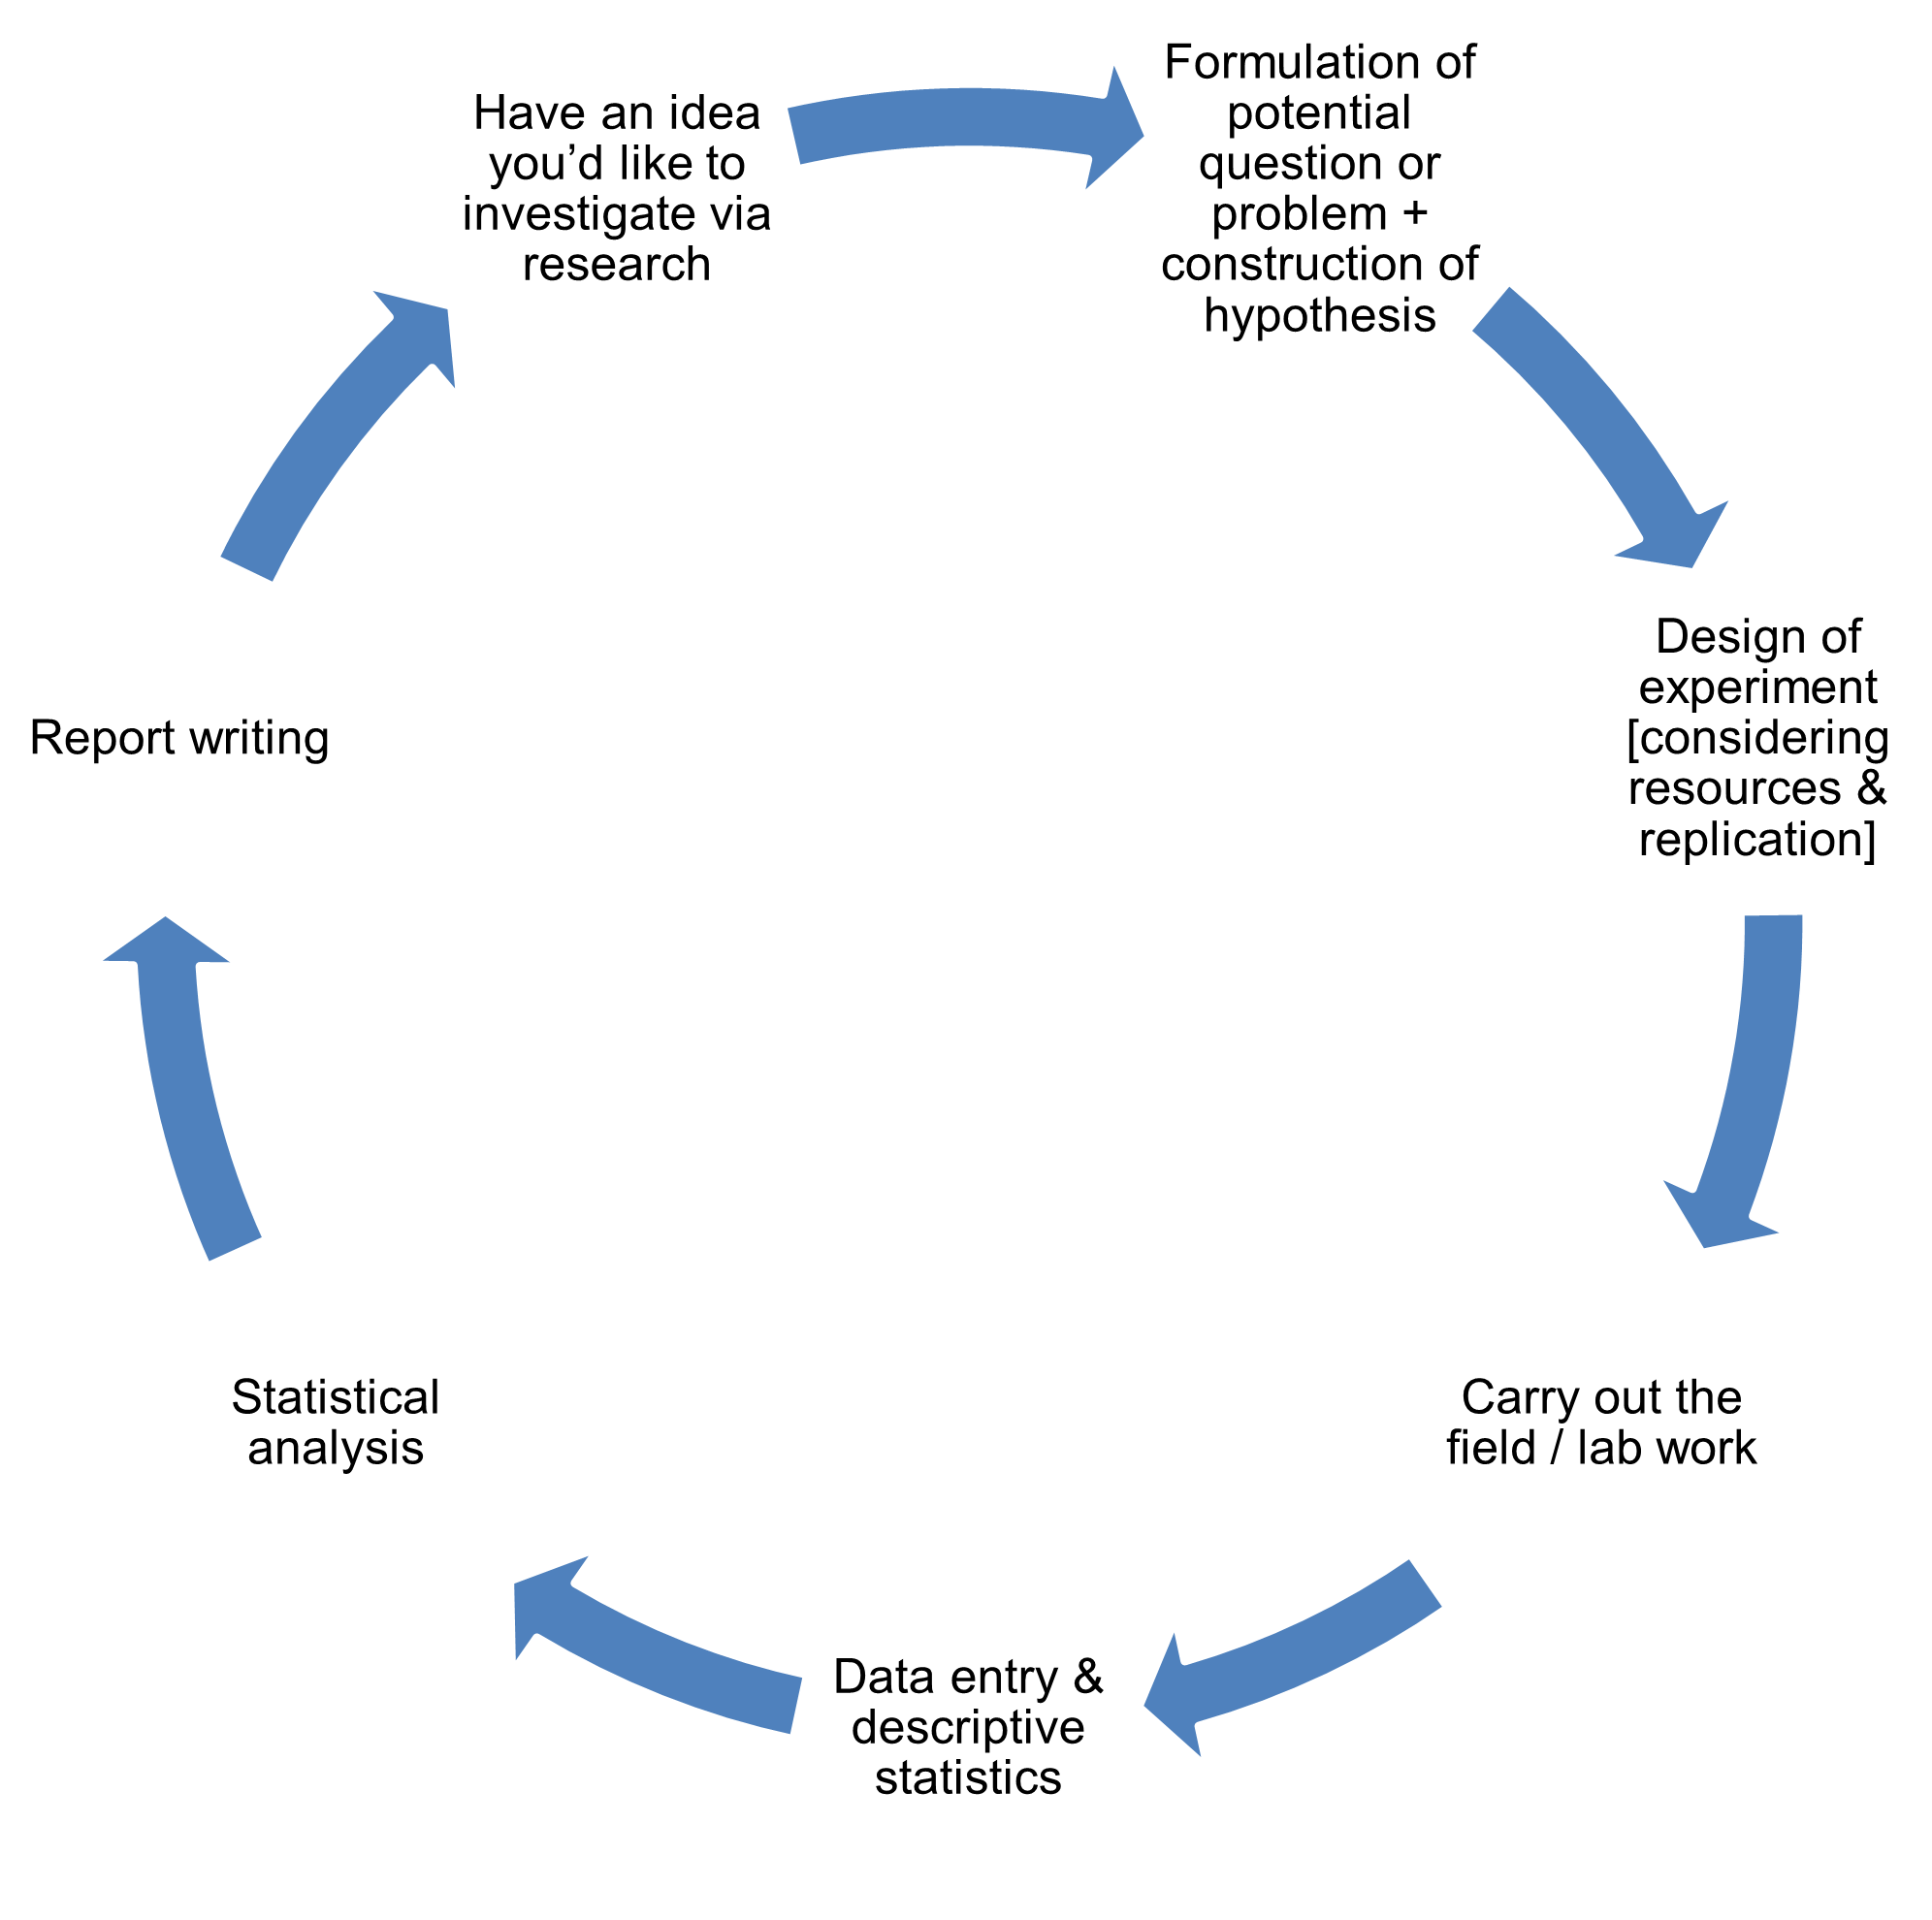
The role of statistics in research
Statistics plays a vital role in modern research by providing rigorous methods to analyse and interpret data. In research, we use statistics to explore patterns in our data, from simple summaries to complex relationships between variables. For example, astronomers used statistical analysis to discover thousands of planets around other stars by detecting tiny, regular dips in star brightness - sometimes as small as 0.01%! Without statistics to separate these tiny signals from random variations in brightness, we would never have found these distant worlds.
These analytical methods go beyond just describing data - they give us the power to draw reliable conclusions. Using techniques like hypothesis testing, we can determine if observed differences between groups are truly meaningful or just due to chance. Perhaps most importantly, we can quantify our uncertainty. Rather than simply claiming “Treatment A works better than Treatment B,” we can state precisely how confident we are in our findings.
Most importantly, these methods enable discoveries that change the world. From measuring the impact of renewable energy breakthroughs to tracking the recovery of endangered species, data analysis replaces guesswork with evidence-based confidence. This approach helps us tackle our planet’s biggest challenges.
Understanding data
Types of data
Data comes in various forms. Understanding these different types helps us choose the right analysis methods:
- Continuous data (measurements on a continuous scale)
- Height measurements
- Temperature readings
- Weight measurements
- Discrete data (counts or whole numbers)
- Number of items in a sample
- Frequency of events
- Population counts
- Categorical data
- Yes/no responses
- Classifications (A, B, C)
- Types or categories
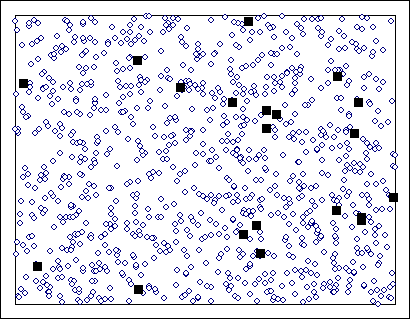
Samples and populations
In research, we often study samples to understand larger populations:
- A population includes all possible cases (e.g., all students at the university)
- A sample is a subset we actually measure (e.g., 100 randomly selected students)
Natural variability
When scientists measure things in nature, they never get exactly the same result twice. For example, if you measure a tree’s height several times, each measurement will be slightly different. This is called natural variability.
In science, we expect and plan for this variation. It happens because the natural world isn’t perfectly uniform - trees in a forest grow to different heights, temperatures change throughout the day, and no two soil samples are identical. Even our measuring tools add some variation to our results.
Statistics gives us ways to work with this natural variation. It helps us understand what’s normal variation and what might signal a real difference that needs our attention. This understanding is essential for making reliable scientific conclusions.
Tools we’ll use
R programming
Don’t worry if you’ve never programmed before! We’ll start with the basics and build your skills gradually. You’ll learn to import and organize data, calculate summary statistics, create informative graphs, and perform statistical tests.
Microsoft Excel
Excel will complement your R skills by helping you organize data, create simple summaries, perform basic calculations, and prepare data for analysis.
Getting help
In general, you can get help through:
- Face-to-face (lectures, tutorials, labs)
- Email consultations
- Ed Discussion forum (public or private posts)
- Drop-in sessions (Floris will organise these and announce them on Ed)
Remember to ask questions early - we’re here to help you succeed.
What’s next?
In the coming weeks, we’ll work with real datasets and learn practical statistical methods that you can apply to data. The first step is to get comfortable with R and Excel, so make sure you’re ready to dive in…